
For one day only, we'll bring together 60 Data & Analytics Leaders from the largest companies within/near Dallas! This is CDM Media's most sought-after event allowing every attendee the opportunity to build new strong professional connections, catch up with like-minded peers, gain the most current insight from those facing similar challenges, generating ideas and best … [Read more...] about Chief Data Officer Dallas Summit
Data Visualization
How Do You Use a Sankey Diagram in Marketing?
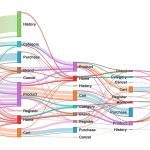
Sankey diagrams are used to visualize the flow of resources or materials. They can be used to depict how much of something goes into or comes out of a system. They are not the same as flow charts, where steps are highlighted in processes. Sankey charts are the best alternatives to common pie charts or bars because both bar and pie charts show the general comparison whereas … [Read more...] about How Do You Use a Sankey Diagram in Marketing?