• Skip to main content
  • Skip to secondary menu
  • Skip to primary sidebar
  • Skip to footer
  • Articles
  • News
  • Events
  • Advertize
  • Jobs
  • Courses
  • Contact
  • (0)
  • LoginRegister
    • Facebook
    • LinkedIn
    • RSS
      Articles
      News
      Events
      Job Posts
    • Twitter
Datafloq

Datafloq

Data and Technology Insights

  • Categories
    • Big Data
    • Blockchain
    • Cloud
    • Internet Of Things
    • Metaverse
    • Robotics
    • Cybersecurity
    • Startups
    • Strategy
    • Technical
  • Big Data
  • Blockchain
  • Cloud
  • Metaverse
  • Internet Of Things
  • Robotics
  • Cybersecurity
  • Startups
  • Strategy
  • Technical

The Ultimate Guide to Data Quality and Business Intelligence

Larisa Bedgood / 8 min read.
July 28, 2015
Datafloq AI Score
×

Datafloq AI Score: 79.33

Datafloq enables anyone to contribute articles, but we value high-quality content. This means that we do not accept SEO link building content, spammy articles, clickbait, articles written by bots and especially not misinformation. Therefore, we have developed an AI, built using multiple built open-source and proprietary tools to instantly define whether an article is written by a human or a bot and determine the level of bias, objectivity, whether it is fact-based or not, sentiment and overall quality.

Articles published on Datafloq need to have a minimum AI score of 60% and we provide this graph to give more detailed information on how we rate this article. Please note that this is a work in progress and if you have any suggestions, feel free to contact us.

floq.to/Qjtvf

Todays marketers are becoming technically savvier. They understand the need to improve customer experiences or implement digital marketing strategies to engage consumers across channels. Customer retention and acquisition, Big Data, social media marketing, and content marketing are just a few of the goals and strategies in todays marketing toolbox.

However, perhaps not so widely discussed are some important fundamentals high quality marketing data.

As marketers we understand that without data, there are no insights. But managing the quality of the data and applying analytics are key to successfully implementing all these other great marketing goals.

When data goes bad, even the best laid out strategies are doomed to fail. After all, Garbage In, Garbage Out, right?

So lets take a step back from the world of Big Data, Digital Marketing, and Customer Experience Management to focus on the basics the data.

Data Quality by the Numbers

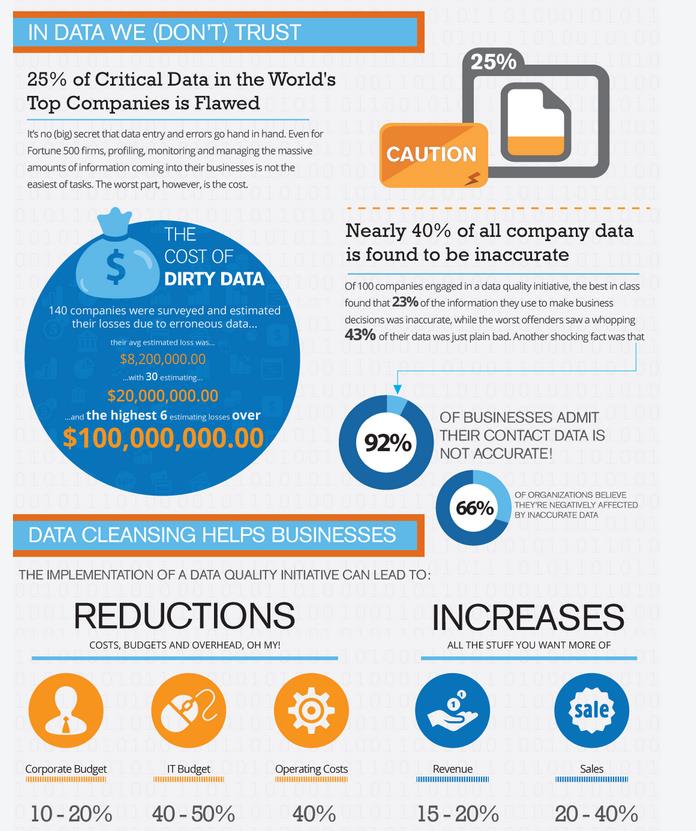
Lets first check out some of these great stats by Halo Business Intelligence:

  • Nearly 40% of all company data is found to be inaccurate.
  • 92% of businesses admit their contact data is not accurate.
  • 66% of organizations believe theyre negatively affected by inaccurate data.

The implementation of a data quality initiative can lead to reductions of:

  • 10-20% corporate budget
  • 40-50% IT budget
  • 40% operating costs

And increases of:

  • 15-20% in revenue
  • 20-40% more sales

data quality infographic

Dirty Data is Damaging

Unfortunately, many organizations take a reactive approach to data management, only taking action when something negative occurs. For example, multiple messages sent to the wrong person damages customer relationships, revealing a need to improve customer information. 

data quality

However, choosing NOT to fix dirty data can be extremely damaging. Consider these data quality horror stories:

  1. Dear Idiot Letter: As customer service representatives at a large financial institution dealt with angry customers, they began entering phrases into the salutation field such as What an idiot this customer is. When the marketing department decided to send a marketing campaign using the customer service database, letters went out as Dear Idiot Customer John Doe. Customer relationships were ruined and the companys reputation was damaged.  
  2. 17,000 Men are Pregnant: Due to incorrectly entered medical codes at British hospitals, thousands of men apparently required obstetric and prenatal exams. These seemingly simple errors caused disastrous results in billing, claims, and regulatory compliance.

While these examples are extreme, the negative impacts of dirty data on your business are very real.

How to Get Your Data in Order

As part of any new data initiative, a business needs analysis should be performed to understand what is required of data moving forward. A business needs analysis focuses on understanding business objectives, strategic goals and business drivers.

For example, what information is required to meet these objectives and how accessible is it to end users? Are data gaps occurring, limiting the availability of required information to support decision-making? What data issues may be impacting revenue, increasing costs, or causing inefficiencies in operations?

Documenting business objectives helps determine what data should be captured, how the data is related, and how data should be structured to create value.


Interested in what the future will bring? Download our 2023 Technology Trends eBook for free.

Consent

Once a data management project is approved, data must be properly cleansed and integrated to ensure information is of the highest quality to drive smarter decision-making across departments.   

Begin by evaluating the quality of your data with a data assessment. Many vendors offer a complimentary assessment to help identify areas where data quality can be improved, what types of data may be missing, and other problems that may be affecting optimal data performance.

Data must also be integrated and placed into a central repository for a complete, 360-degree view of the customer or other business area. Data quality software automates integration processes and improves data quality by performing the following functions:

  • Parsing and standardization
  • Matching and linking data
  • Monitoring to ensure data continues to align with business rules
  • Enrichment through data appending

Business processes should also be established to ensure data manually entered into systems is of the highest quality possible. As we learned previously in our example of the pregnant men, many organizations experience data errors when information is manually entered, at a rate of 2% and 8%.  Even one wrong number entered incorrectly can cause a payment to fail, a wrong part number to be shipped, or apparently a man to become pregnant.

Data validation controls can be integrated into on-line forms, using rules to check the validity of data sets. For example, an on-line website form may require a visitor to enter data in specified formats. Or an IRS form may utilize controls to check that positive numbers are being entered into fields.  Training employees to be more aware of the importance of data quality is also a crucial step to achieve a company-wide awareness of maintaining high quality information.

Analyze Your Data Create Customer Segments

With an integrated and clean database in place, customer analytics can be applied to target customers with the most relevant offers. Begin by creating customer segments. Customer segmentation refers to dividing customers into groups who share similar characteristics, such as age, gender, lifestyle, and so on.

Any number of segments can be created as long as each segment is:

Large Enough to be Profitable:  The segment should not be too narrow, making it cost-prohibitive to reach these customers. The segment should be worthy of the marketing efforts.

Accessible:  The consumers must be able to be reached through channels already established, such as a website or store, or by new channels that can easily be created.

When creating customer segments, a company must consider a wide range of customer characteristics, such as:

  • Behavioral:  characteristics such as product usage and frequency of purchase.  
  • Demographics:  factual characteristics, such as age, gender, occupation, and income. For example, are the majority of your customers female or male? Where do they live? Are they single or married?  
  • Psychographics: values, attitudes, lifestyles. Psychographic information answers questions such as what motivates your customers to buy your products and services? What are their key values? What are their hobbies and habits?  
  • Value-Based: actual or potential revenue of customers and the costs of maintaining relationships with them. Analyzing these attributes allows marketers to allocate resources to the most-profitable customer groups.

Based on any combination of these characteristics, companies can develop key customer segments and develop marketing strategies designed to generate the most profit from each unique customer group. A company may want to enhance loyalty, increase customer value, or provide products and services to a particular geographic area.

Consider the following examples:

  1. Geographic segmentation
    Marketers may create segments based on geographic location, such as neighborhoods, cities, states, regions, or postal codes. A local retailer may want to only target consumers within a certain radius of the store. Or a large retailer selling seasonal products, such as winter coats, will concentrate more marketing efforts on areas with colder weather.  
  2. Life Stage segmentation
    Life stage segmentation requires looking at a combination of demographics and psychographics characteristics to determine where consumers are in their life cycle. Different marketing techniques will appeal to different segments. Targeting a college student will be much different than targeting a young family or senior citizen.  
  3. Customer-value based segmentation
    By creating segments based on transactional history, such as average spend, products purchased and frequency of purchase, companies can devote more resources and create best-in-class offers for their most profitable customers. A bank may want to increase the credit card limit for high-spend, high-value customers. Or an on-line retailer may offer free shipping to profitable customer segments.  
  4. Buying Frequency segmentation
    Creating a segmentation based on buying frequency is good for targeted marketing campaigns, such as re-engaging past customers or rewarding frequent shoppers. For example, by creating a segment of customers who have not purchased in the past six months, a special incentive can be sent to this group.

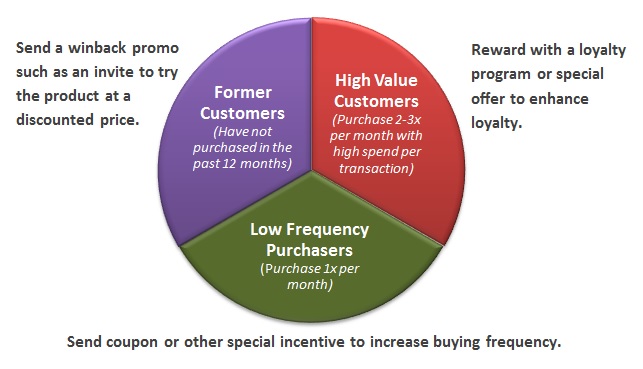
In the following example, a regional retailer has identified three segments
and the marketing strategy for each.  

rfm segmentation model  

Use Modeling to Predict

Similar to segmentation, predictive modeling allows marketers to develop very precise, targeted campaigns. Both techniques examine the characteristics of customers and prospects, however modeling takes this one step further by also predicting future behaviors. Modeling is the practice of forecasting consumer behaviors and assigning a score based on the likelihood of completing a desired action, such as purchasing a product. For example, which customers are most likely to spend the most across a 6-month cycle?

Check out the following examples of how a predictive model may be used:

  1. Response modeling
    This type of modeling is used to identify customers or prospects most likely to respond to marketing offers. By collecting and analyzing data on individual customers, marketers assign scores to individuals representing their likelihood to perform a desired action, such as a product purchase. Highly targeted offers can then be sent to those with the highest scores.  
  2. Propensity to Purchase Model
    This refers to the likelihood of a customer to purchase a particular product. By better understanding a customers purchase propensity, companies are more likely to up-sell or cross-sell these customers. Types of data that are often included in this type of model include purchase behavior in the last 12 months, amount of spend, frequency, and other actions such as increased clicks on a website. By understanding a customers likelihood to buy, consumers in the market can be targeted with the right offers at the right time.  
  3. Customer Churn modeling
    By better understanding what is causing customers to stop using your services or switch brands, processes can be put into place to mitigate churn risk.  A customer churn model evaluates customer behaviors such as purchase frequency and date of last purchase. A possible indicator that a customer may be thinking of leaving is decreased purchasing frequency. By implementing triggers based on changing customer behaviors, customer retention strategies can be put into place before a customer switches brands.

Data quality and business intelligence are critical for success in todays economy. More companies are increasingly investing in data management and business intelligence solutions to maintain high quality data and target multi-channel consumers. And with better data insights, marketers are better able to focus on todays data-driven, technically-savvy marketing strategies.

Categories: Big Data
Tags: Big Data, customers, data quality, dirty data, infographic

About Larisa Bedgood

As an omnichannel data powerhouse, V12 Data combines rich data assets with robust technology to provide brands with a seamless and connected customer view. Our solutions bridge the right data across channels to power right time omnichannel engagement when, where, and how a brands' customers prefer. Our data and technology platform links customer records with our proprietary blend of online, offline and digital marketing data for highly personalized, one-to-one consumer marketing, regardless of device or channel.

As a motivated marketing professional, I successfully develop and implement demand generation initiatives and market brand awareness strategies. I have a deep understanding of today's data-driven marketing environment, and have developed my skill-set to support customer relationship-building, content marketing techniques, and inbound and outbound marketing methods.

www.v12data.com

Primary Sidebar

E-mail Newsletter

Sign up to receive email updates daily and to hear what's going on with us!

Publish
AN Article
Submit
a press release
List
AN Event
Create
A Job Post

Related Articles

What is Enterprise Application Integration (EAI), and How Should Your Company Approach It?

March 29, 2023 By Terry Wilson

Technology for Marketing, Singapore

March 29, 2023 By r.chan

eCommerce Expo, Singapore

March 29, 2023 By r.chan

Related Jobs

  • Software Engineer | South Yorkshire, GB - February 07, 2023
  • Software Engineer with C# .net Investment House | London, GB - February 07, 2023
  • Senior Java Developer | London, GB - February 07, 2023
  • Software Engineer – Growing Digital Media Company | London, GB - February 07, 2023
  • LBG Returners – Senior Data Analyst | Chester Moor, GB - February 07, 2023
More Jobs

Tags

AI Amazon analysis analytics app application Artificial Intelligence BI Big Data blockchain business China Cloud Companies company costs crypto customers Data development digital environment experience finance future Google+ government information learning machine learning market mobile Musk news public research security share social social media software startup strategy technology twitter

Related Events

  • 6th Middle East Banking AI & Analytics Summit 2023 | Riyadh, Saudi Arabia - May 10, 2023
  • Data Science Salon NYC: AI & Machine Learning in Finance & Technology | The Theater Center - December 7, 2022
  • Big Data LDN 2023 | Olympia London - September 20, 2023
More events

Related Online Courses

  • Big Data & AI World, Singapore
  • Velocity Data and Analytics Summit, UAE
  • Big Data – Capstone Project
More courses

Footer


Datafloq is the one-stop source for big data, blockchain and artificial intelligence. We offer information, insights and opportunities to drive innovation with emerging technologies.

  • Facebook
  • LinkedIn
  • RSS
  • Twitter

Recent

  • How to Validate OpenAI GPT Model Performance with Text Summarization (Part 1)
  • What is Enterprise Application Integration (EAI), and How Should Your Company Approach It?
  • 5 Best Data Engineering Projects & Ideas for Beginners
  • Personalization Vs. Hyper-Personalization: Benefits, Limitations and Potential
  • Explaining data products lifecycle and their scope in management

Search

Tags

AI Amazon analysis analytics app application Artificial Intelligence BI Big Data blockchain business China Cloud Companies company costs crypto customers Data development digital environment experience finance future Google+ government information learning machine learning market mobile Musk news public research security share social social media software startup strategy technology twitter

Copyright © 2023 Datafloq
HTML Sitemap| Privacy| Terms| Cookies

  • Facebook
  • Twitter
  • LinkedIn
  • WhatsApp

In order to optimize the website and to continuously improve Datafloq, we use cookies. For more information click here.

settings

Dear visitor,
Thank you for visiting Datafloq. If you find our content interesting, please subscribe to our weekly newsletter:

Did you know that you can publish job posts for free on Datafloq? You can start immediately and find the best candidates for free! Click here to get started.

Not Now Subscribe

Thanks for visiting Datafloq
If you enjoyed our content on emerging technologies, why not subscribe to our weekly newsletter to receive the latest news straight into your mailbox?

Subscribe

No thanks

Privacy Overview

This website uses cookies so that we can provide you with the best user experience possible. Cookie information is stored in your browser and performs functions such as recognising you when you return to our website and helping our team to understand which sections of the website you find most interesting and useful.

Necessary Cookies

Strictly Necessary Cookie should be enabled at all times so that we can save your preferences for cookie settings.

If you disable this cookie, we will not be able to save your preferences. This means that every time you visit this website you will need to enable or disable cookies again.

Marketing cookies

This website uses Google Analytics to collect anonymous information such as the number of visitors to the site, and the most popular pages.

Keeping this cookie enabled helps us to improve our website.

Please enable Strictly Necessary Cookies first so that we can save your preferences!