The best trained soldiers can't fulfill their mission empty-handed. Data scientists have their own weapons ” machine learning (ML) software. There is already a cornucopia of articles listing reliable machine learning tools with in-depth descriptions of their functionality. Our goal, however, was to get the feedback of industry experts. And that's why we interviewed data … [Read more...] about Best Machine Learning Tools: Experts’ Top Picks
data visualisation
5th International Conference and Expo on Computer Graphics & Animation
The 5th International Conference and Expo on Computer Graphics & Animation taking place 26-27th September at Montreal, Canada is an academic and business opportunities for next-generation technologies and strategies from the world of Computer Graphics, Animation, Game Design, VR and CGI Companies an opportunity to explore and discover the latest trends and research … [Read more...] about 5th International Conference and Expo on Computer Graphics & Animation
Machine Learning Project Structure: Stages, Roles, and Tools
Various businesses use machine learning to manage and improve operations. While ML projects vary in scale and complexity requiring different data science teams, their general structure is the same. For example, a small data science team would have to collect, preprocess, and transform data, as well as train, validate, and (possibly) deploy a model to do a single … [Read more...] about Machine Learning Project Structure: Stages, Roles, and Tools
Virtual Reality for Data Centers – A Competitive Advantage
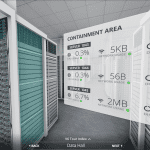
We work with a host of clients, helping them bring massive spaces, data and physical assets into the digital world. The technology makes it possible for anyone, located anywhere in the world, to explore their space in both 3D and virtual reality (VR). Tens to hundreds of thousands of square feet - and all of the details and assets inside and out - can be at your fingertips … [Read more...] about Virtual Reality for Data Centers – A Competitive Advantage
Data Visualization and BI Reporting 17 May 2018, Amsterdam
Data visualization is a general term that describes any effort to help people understand the significance of data by placing it in a visual context. Patterns, trends and correlations that might go undetected in text-based data can be exposed and recognized easier with data visualization technology. Data visualization has now become the de facto standard for Business … [Read more...] about Data Visualization and BI Reporting 17 May 2018, Amsterdam


