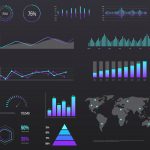
Big data increasingly drives the business world. However, the insights from data are only valuable if decision-makers can understand them. This is sometimes a challenge for non-technical stakeholders, whose forte in other areas might not extend to interpreting complex technical information. Thus, visualization is critical to communicating effectively and carrying everyone along … [Read more...] about Leveraging Visuals to Simplify Big Data Analytics for Non-Technical Stakeholders
big data visuals
Power BI vs. Excel: Which is Better for Data Analysis?
Microsoft's Power BI has more than 25,000 US customers conducting visual data analysis. Meanwhile, MS Excel's global user base estimates lie between 1 to 1.5 billion. However, the former specializes in business intelligence, while the latter has occupied every individual's device and workflow. Both offer remarkable advantages for insight extraction. This post will include Power … [Read more...] about Power BI vs. Excel: Which is Better for Data Analysis?
Chief Data Officer Dallas Summit
For one day only, we'll bring together 60 Data & Analytics Leaders from the largest companies within/near Dallas! This is CDM Media's most sought-after event allowing every attendee the opportunity to build new strong professional connections, catch up with like-minded peers, gain the most current insight from those facing similar challenges, generating ideas and best … [Read more...] about Chief Data Officer Dallas Summit
12 Data Visualization Software Tools
In the world of Data, data visualization tools and technologies are essential to analyze massive amounts of information and make data-driven decisions. Our eyes are drawn to colors and patterns. We can quickly identify red from blue, square from circle. Our culture is visual, including everything from art and advertisements to movies. What is Data Visualization Software? Data … [Read more...] about 12 Data Visualization Software Tools
Data Visualization Summit 2018
Transforming Data into actionable insights Data visualization is vital to communicate and showcase data dynamically to better understand and disseminate your data. The potential scope of data visualization stretches further than ever before; using visualization for social sharing and storytelling, the use of real-time dashboarding as well as the introduction of AI and VR … [Read more...] about Data Visualization Summit 2018


