


Statistics has its own significance in data science, but it’s not the only thing which data scientists have to deal with. Statistics are of two kinds “ Bayesian and Classical.
When people start talking about statistics, they are most often talking about classical statistics; but understanding both is beneficial. When you focus more on machine learning algorithms and inferential techniques, you will need to use linear algebra more than usual.
The commonly used way to address hidden characteristics within a data set is known as SCD. The method SCD has its grounding in matrix math and hardly need classical statistics. A data scientist should have a proper understanding of mathematics in all areas.
Traditional Methods for Statistics
Processing of big data can’t be achieved through conventional methods. Instead, when it comes to unstructured data, you will need specialized data modelling systems, techniques, and tools to remove information and insights as required by businesses.
Data science is applied as a scientific approach that uses statistical and mathematical ideas along with computer tools to easily process big data. It leverages different areas to align and prepare big data in order to drive information and insights. The key areas are as under-
- Data programming
- Data mining
- Data cleansing
- Intelligent data capture techniques
- Mathematics and
- Statistics
Sample
A subset of the population taken because the entire community is usually too large to analyze its characteristics are considered to be representative of the population
Mean
The Central value, which refers to the average of the data, is called mean. It is defined by summing all the points in the population and dividing it by the total population.
# Python program to demonstrate mean()
# function from the statistics module
# Importing the statistics module
import statistics
# list of positive integer numbers
data1 = [1, 3, 4, 5, 7, 9, 2]
x = statistics.mean(data1)
# Printing the mean
print("Mean is :", x)
Median
The Median is the value that separates the higher half of a sample from the lower half.
The median value is achieved by arranging all the benefits from smallest to uppermost and taking the middle one.
# Python code to demonstrate the
# working of median() function.
# importing statistics module
import statistics
# unsorted list of random integers
data1 = [2, -2, 3, 6, 9, 4, 5, -1]
# Printing median of the
# random data-set
print("Median of data-set is : % s "% (statistics.median(data1)))
# Python code to demonstrate
# StatisticsError of median()
# importing the statistics module
from statistics import median
# creating an empty data-set
empty = []
# will raise StatisticsError
print(median(empty))

Variance
Measures dispersion around the mean and determined by averaging the squared differences of all the benefits from the mean
# Python code to demonstrate the working of
# variance() function of Statistics Module
# Importing Statistics module
Import statistics
# Creating a sample of data
sample = [2.74, 1.23, 2.63, 2.22, 3, 1.98]
# Prints variance of the sample set
# Function will automatically calulate
# it's mean and set it as xbar
print("Variance of sample set is % s"%(statistics.variance(sample)))
The variation of a population is σ2
Standard Deviation
The square root of the variance. Also measures dispersion around the mean but in the same units as the values (instead of square units with variation)
# Python code to demonstrate stdev() function
# importing Statistics module
Import statistics
# creating a simple data - set
sample = [1, 2, 3, 4, 5]
# Prints standard deviation
# xbar is set to default value of 1
print("Standard Deviation of sample is % s "% (statistics.stdev(sample)))
# Python code to demonstrate use of xbar
# parameter while using stdev() function
# Importing statistics module
import statistics
# creating a sample list
sample = (1, 1.3, 1.2, 1.9, 2.5, 2.2)
# calculating the mean of sample set
m = statistics.mean(sample)
# xbar is nothing but stores
# the mean of the sample set
# calculating the variance of sample set
print("Standard Deviation of Sample set is % s"%(statistics.stdev(sample, xbar = m)))
σ is the standard deviation of the population and s is the standard deviation of the sample
Standard Error
The standard error is an estimate of the standard deviation of the distribution of sampling. Sample distribution is the set including all samples of size.
Statistics is the grammar of science. “ Karl Pearson
When it comes to data science, it is essential that you have a good understanding of statistics so that you can convey the message that you need to.
Poisson Distribution
A Poisson distribution equation is applied to find the number of events that can happen during a continuous time interval.
One example would be the number of phone calls that could occur during a particular time or the number of people that could end up in a queue.
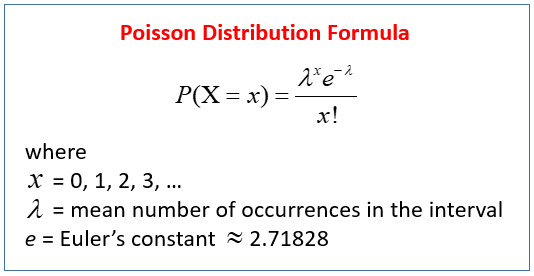
This is a relatively simple equation to remember. The symbol is known a lambda. This is what represents the average amount of events that happen during a specific interval of time.
An example of this distribution equation is to figure out the loss in manufacturing sheets of metal with a machine that has X flaws that happen per yard. For instance, the error rate is 2:1, or 2 errors per metal yard.
Binomial Distribution
Binominal distribution is the common distribution type that data science students learn in their basic statistics class.
Let’s say our experiment is flipping a coin. Individually, the currency is flipped only three times. Can you find the odds that the coin will be on the head side?
Using combinatorics, we know that there are 2^3 or eight different results combinations.
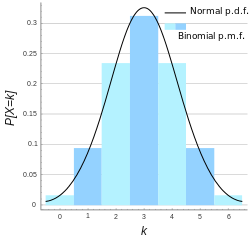
By graphing the odds of getting three heads, two heads, one head, and 0 heads. This instance is considered to be your binomial distribution. You will find it as a normal distribution on a graph since binomial and normal distributions share similarities. The difference between the two is that one is discrete and the other is continuous.
ROC Curve Analysis
ROC analysis curve is required in both data science and statistics. It reveals the model performance or tests model performance by looking at the total sensitivity VS its fallout rate.
Can you tell the odds for correct prediction?
Since statistics and forecasts are just supported guesses, it becomes essential that you are right. With a ROC curve, you are able to see how correct the predictions are and using the two parables figure out where to place the threshold
Bayes Theorem
Bayes Theorem is a must to learn for computer minded people. You can find more about Bayes Theorem in lots of books. The best thing about the theorem is that it simplifies complex concepts.
It provides a lot of information about statistics in just a few variables. It works well when combined with conditional probability. When this happens, it will help in the resulting action.
It will allow you to predict the odds of your hypothesis when you give it specific points of data
K-Nearest Neighbor Algorithm
This is one of the most comfortable algorithms to learn and use, so much so that Wikipedia refers to it as the lazy algorithm.
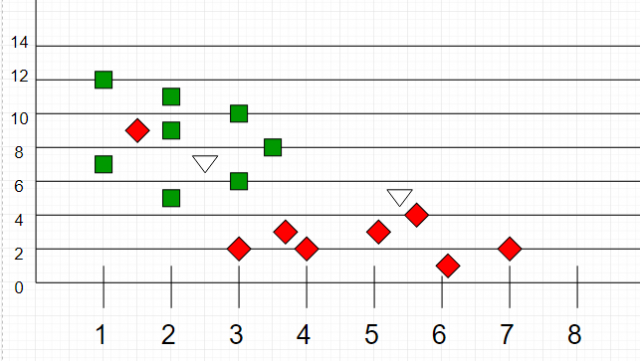
The concept of the algorithm is fewer statistics based and more reasonable deduction. In other words, it helps identify the groups closest to each other. When you use k-NN on a two-dimensional model, it will depend on Euclidian distance.
Scikit Learn “ This is used for machine learning
Scikit Learn was designed and developed onto matplotlib, NumPy, and Scipy. This library includes numerous helpful tools for machine learning solutions and statistical modeling, such as dimensionality reduction, regression, clustering, and classification.
Statsmodels “ This is used for statistical modeling
This is a Python module that will let its users explore data, perform statistical tests, and estimate mathematical models. You can find an extensive list of things like result statistics, plotting functions, statistical analysis, and descriptive statistics, and these can be used for different data types.
Python may not be the popular programming language among all data scientists, but it’s the best to start with. It happens when data scientists find other programming languages more pleasant, well-designed, and more interesting to code with. However, they still use Python in the end to start a new data science project. It is just like the concept of learning maths- you need to practice it to develop a better understanding.
While math and statistics may seem tedious, they are fantastic tools, especially when it comes to data science. Statistics can be applied in numerous ways to several things from the lottery participation to DNA testing. It can be even used to determine the factors related with the conditions like heart disease and cancer. They can also help people spot cheating on standardized tests. You can even win game shows with the help of statistics.
