


“I think, I probably am.” Kevin Gray
Applied statistics provides our way of thinking and our approach to extracting the most information from numbers with uncertainty. It emphasizes an understanding of the problem or industry. Applied statistics follows a process that folds together the domain and statisticsin the vein of Deming or Six Sigma. The point is that even if we are using Exploratory Data Analysis/Statistical Data Mining, we need to have at least a general idea of what we are seeking.
Figure 1 illustrates how we can think about business analytics problems in two dimensions: an understanding of the business problem and an understanding of statistics.
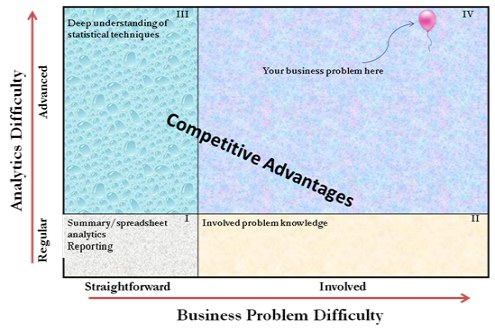
Figure 1: Business Analytics Capability Chart
(See ‘A Practitioner’s Guide To Business Analytics,’ McGraw-Hill, p. 52.)
The thinking comes first and then we decide what tools apply. The choice of tool is driven by the objective, the structure of the data, and the nature of the uncertainty in the numbers.
A major source of confusion comes from the mistake of equating applied statistics with academic statistics. Academic statistics either emphasizes publishing or teaching. Applied statistics is the profession of analyzing data and it is not limited to a set of tools provided by academic statisticians. Academic statisticians are the main vendors, but not the only vendors, of statistics tools for statistics problems. Statistics experiences the same dynamic between academia and application as other fields, like economics. Many fields, like statistics, have a ‘the more you know, the less you know’ quality.
Applied Statistics Is About The Problem:
We will summarize a problem-based definition of statistics. Applied statistics equals data analysis. It is our way of thinking about and solving problems involving uncertainty with the numbers. We provide a problem-based definition of statistics in the May/June 2015 issue of Analytics Magazine, https://goo.gl/Wod3gk, where we discuss four common sources of uncertainty:
- inferential;
- missing values;
- measurement error;
- surrogate variables.
Statistics will leverage any tools for extracting as much information as the data contains and statistics comprises mathematics, logic, algorithms, and assumptions for uncertainty. The presence of uncertainty leads us to infer rather than deduce solutions and it is statistics that we rely upon to measure the accuracy and reliability of the extracted information.
We can minimize the confusion by circulating the needed vocabulary to articulate the numerous tools and subfields in statistics. The family of statistics solutions complete each other in a manner similar to addition, subtraction, multiplication, and division. There are four objectives for statistics models: prediction, coefficient estimation, ranking, and grouping. Here is a mix of common statistics tools and the overlapping genealogy.
Table 1: Portmanteau Statistics
|
Grouping (Genus) |
Tools (Species) |
|
Exploratory Data Analysis (EDA) |
Packaging of tools for quick insights; emphasis on graphics, usually for observational data: e.g., Box-Plots, Bubble Graphs, CART, Clustering, Density Plots, Histograms, k-NN, Outlier Detection, Scatterplots, Smoothing, Time-series plots, et al. |
|
Statistical DM (Data Mining) |
Rebranding of EDA; more discussion of some topics and less of others. Data Mining is used to straddle data analysis and data management. |
|
Statistical ML (Machine Learning) |
The data-analysis part of the ML packaging of statistics and data management tools with a machine learning engine, e.g., Topic Modeling, Support Vector Machines, Random Forests, Tree-Based and Rule-Based Regression and Classification, Genetic Algorithms, Gradient Boosting, Neural Networks, et al. |
|
Statistical Learning |
Evolving definition, at least partly a repackaging/rebranding of Statistical ML, e.g. Linear and Polynomial Regression, Logistic Regression and Discriminant Analysis; Cross-Validation/Bootstrapping, model selection and regularization methods (Ridge and Lasso); Nonlinear Models, Splines and Generalized Additive Models; Tree-Based Methods, Random Forests and Boosting; Support-Vector Machines. Some Unsupervised Learning Methods are discussed: Principal Components and Clustering (K-Means and Hierarchical). |
|
Statistical DS (Data Science) |
Evolving definition, rebranding of applied statistics; more discussion of some topics and less of others. Data Science was coined as a rebranding of applied statistics and now it is used to straddle data analysis and data management. |
|
Bayesian |
Techniques that assume a prior distribution for the parameters–its a long story, e.g., Naive Bayes, Hierarchical Bayes, et al. |
|
Predictive Analytics |
Rebranding of Predictive Modeling |
|
Multivariate Statistics |
Clustering, Factor Analysis, Principal Component Analysis, Structure Equation Modeling, et al. |
|
Spatial Statistics |
Packaging of tools for modeling spatial variability, e.g., Thin-plate Splines, Inverse Distance Weighting, Geographically Weighted Regression. |
|
Parametric Statistics |
All tools making parametric assumptions; e.g., Regression |
|
Nonparametric Statistics |
All tools not making parametric assumptions; they still make assumptions: e.g., Association Analysis, Neural Networks, Order Statistics, Rank Statistics, Quantile Regression, et al. |
|
Semi-parametric |
Family of models containing both parametric and non-parametric components (e.g. Cox-proportional hazard model) |
|
Categorical Data Analysis |
Statistics for a categorical response, e.g., Contingency Tables, Cochran-Mantel-Haenszel Methods, General Linear Models, Loglinear Models, Logit Models, Logistic Regression, et al. |
|
Time Series/Forecasting |
Tools modeling a time (or location) dependent response; e.g., ARIMA, Box-Jenkins, Correlograms, Spectral Decomposition [Census Bureau] |
|
Survival Analysis |
Statistics to perform time-to-event analysis (also called duration analysis), e.g., Cox Proportional Hazard, Kaplan-Meier, Life Tables, et al. |
|
Game Theory |
Statistics tools for modeling contests. |
|
Text Analytics |
Tools for extracting information from text. |
|
Cross Validation/Data Splitting |
Model validation techniques with no replacement for assessing statistical results, e.g., K-fold Cross-Validation, Sequential Validation |
|
Resampling Techniques With Replacement |
Model validation techniques with replacement for assessing statistical results, e.g., Permutation Tests, Jackknife, Bootstrapping, et al. |
|
Six Sigma |
Repacking of statistics common to manufacturing with clever organizational ideas. |
|
Quality/Process Control |
Statistics for processes, usually observational data, e.g., X-Bar Charts, R Charts, [Manufacturing] |
|
DoS (Design of Samples) |
Statistics for collecting sampling units, e.g., Simple Random, Systematic, Stratification, Clustering, Probabilities Proportional to Size, Multi-stage Designs, Small Area Estimation, Discrete Choice, Conjoint Analytics [Census Bureau; Marketing] |
|
DoE (Design of Experiments) |
Tools for assigning treatments to experimental units, e.g., Completely Randomized, Randomized Blocks, Factorial Designs, Repeated Measures, Split-Plot, Response Surface Models, Crossover Designs, Nested Designs, Clinical Modifications [Agriculture; Pharmaceuticals] |
|
DSim (Design of Simulation) |
Artificial generation of random processes to model uncertainty; Monte Carlo, MarkovChains, |
|
Stochastic Processes |
Models for processes (with uncertainty), e.g., Birth-Death Processes, Markov Chains, Markov Processes, Poison Processes, Renewal Processes, et al. |
|
Areas awaiting a formal name |
E.g., high dimensional problems (p>>n); et al. |
In making an attempt at this ever-changing genealogy, we admit to shortcomings. The larger point is that statistics problems have uncertainty with the numbers and these require statistics tools, regardless of repackagings, rebrandings, and mischaracterizations. The problems require statistics assumptions and thinking, and so there can be no escape.
Close:
We are well into a knowledge-based economy. Many decision makers want good information in a timely manner when there is uncertainty with the numbers. We should equate problem-based, applied statistics with the thinking required to solve these statistics problems and not just the tools from STAT 201. The later is a misinterpretation of academic training.
We sure could use Deming, right now. Many of us, who consume or produce data analysis, hang out in the new LinkedIn group: About Data Analysis.
The entire Statistical Denial series can be found on Datafloq.
- Statistical Denial 1, Blog 1: Essays On Statistics Denial
- Statistical Denial 2: Statistics Debacles & The Coming Flood Of Statistical Malfeasance
- Statistical Denial 3: Applied Statistics Is A Way Of Thinking, Not Just A Toolbox
- Statistical Denial 4: Five Forces Pushing Statistics Expertise Out of Data Analysis
- Statistical Denial 5, Myth 1: Traditional Techniques Straw Man
- Statistical Denial 6, Myth 2: Why Statisticians Not Only Practice Within Traditional Statistics
- Statistical Denial 7, Myth 3: Are Data Mining and Machine Learning Distinct from Statistics?
- Statistical Denial 8, Myth 4: Why Prediction Is / Is Not Part of Statistics
- Statistical Denial 9, Myth 5 and 6: Why Statistical Significance Does Work For Big Data
- Statistical Denial 10, Myths 7, 8 and 9: 3 Statistics Denial Myths on the Volume of Big Data
- Statistical Denial 11, Myths 10 and 11: Debunking the Myth that None of Statistics Works for Big Data
- Statistical Denial 12, Myth 12: Publications Straw Man
- Statistical Denial 13, Myths 13 and 14: Minimizing The Profession
