



A Case Study approach towards understanding Entities & Requirements in Data Science Space
Around four and a half years back, I was struggling to understand the whole concept of Data Science. Coming from a non-Statistics background, I was skeptical, worried and more importantly I was obnoxious. I had doubts about if I will be able to sustain in an industry which I presumed was statistics heavy. But here I am, still sailing through the wind while picking up a few skills in the process. I am not going to teach you data science because I am still learning it. But I will tell you my experience of working with Mu Sigma and Novartis, starting from zero and managing to climb up the ladder, slowly and steadily
I always hear a lot of questions on what constitutes a data science project? Are there multiple cross functionalities that combine to form this broader spectrum? Can an individual from a non-computer science or a non-statistics background make it to this industry? Multiple entities combine to form a Data Science group. Often the roles and responsibilities are pre-defined and require a unison style of working to achieve a bigger goal. The sole aim of this article is to give you a flavor of these entities and help you chose a track rather than jumping into an online course.
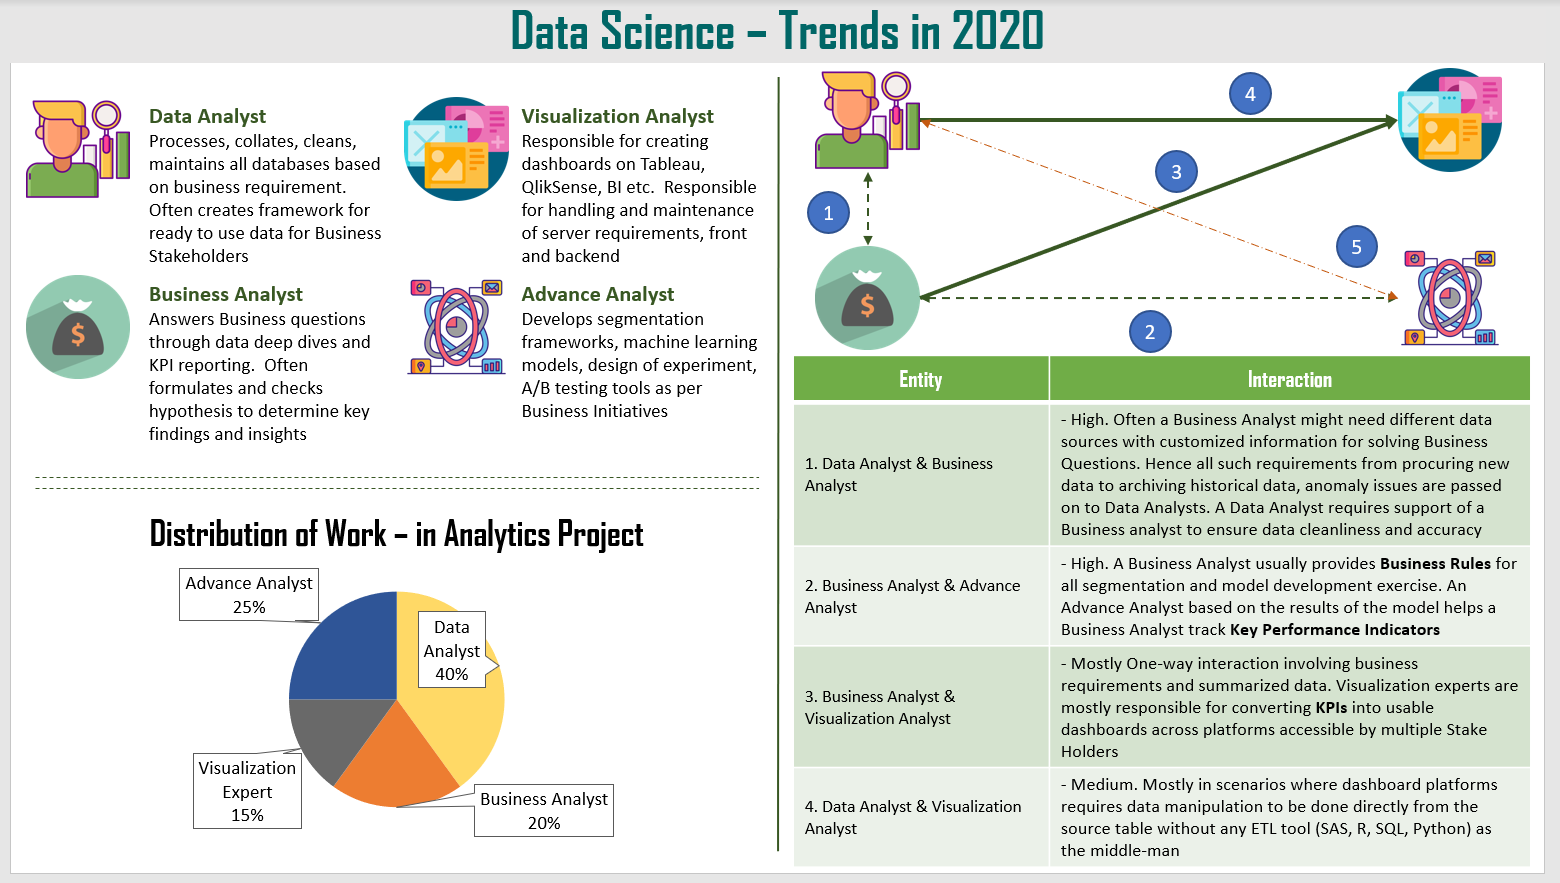

Let me take an example to explain the interaction between different entities. A big pharmacy retailer (a company that sells medicine) is planning to expand its market and improve revenue. As a part of the process, they decided to talk to the doctors and make them aware of all the benefits that patients will receive upon visiting their pharmacy. The benefit could be in terms of specialized care, discounts, lower queues or wait time, drug availability, smoother insurance claim process and so on. This process is often termed as Physician Targeting . Now to kick off this initiative the Head of Analytics decides to bring in all four teams under one roof.
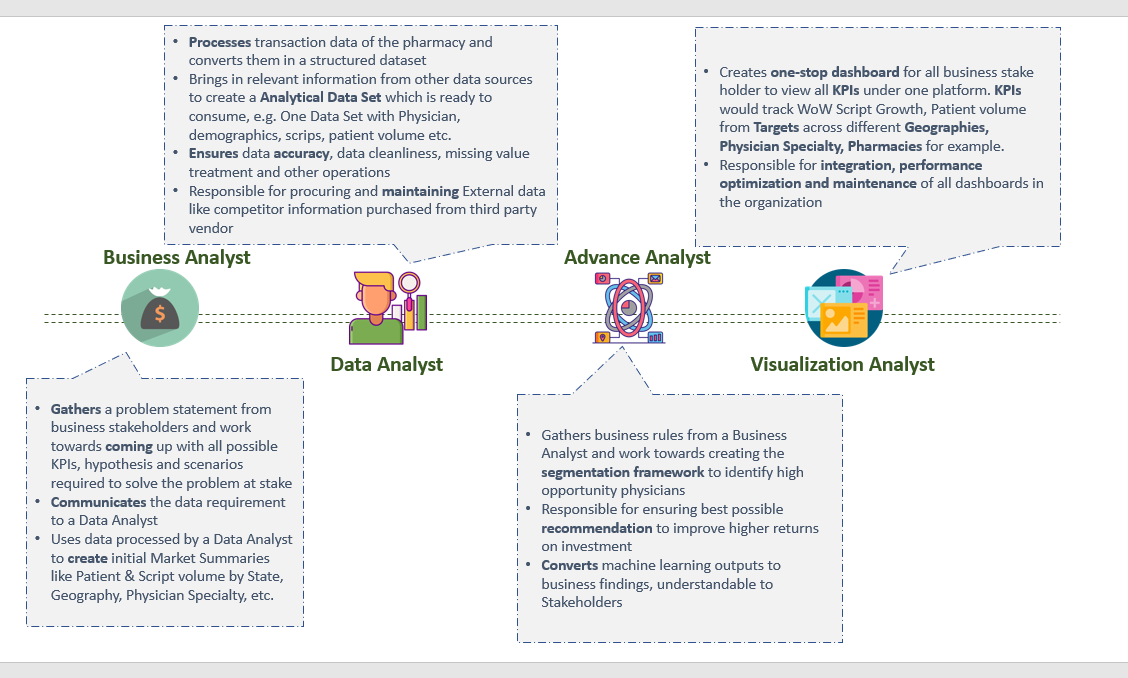

Role of a Business Analyst
A Business Analyst in this project is expected to interact with different stakeholders like Brand Heads, Pharmacists, Shop Manager, Sales Representatives and understand how the market operates. This will help them think of all possible Key Performance Indicators (KPIs) and use them towards prioritization of Physicians that needs to be targeted.
Say a Business Analyst identifies Patient Volume (total patients visiting a doctor), Scripts (prescriptions written), Physician Specialty (like if the doctor is a Neurologist, Cardiologist, Family Physician, etc.), Patient Demographics (people living in an around the pharmacy, their age, income, medical history) & Competitor Market (revenue, patient volume generated by competitor pharmacies) as some of the KPIs. Now they will pass on the data requirements to the Data Analyst team. However, the role of a Business Analyst doesn’t stop here. They are expected to create reports on the initial market trends and summaries like patient and script volume by Physician specialty, Geography, etc. once they receive the data feed.
Requirements for a Business Analyst
- Understanding of how the Health Care System operates
- An Analytical mindset to be able to identify different problem areas, possible factors contributing to those areas and more importantly a critical approach to question every hypothesis, trends, and business figures
- Basic statistical concepts like descriptive statistics (mean, median, mode and when to use them), correlation, hypothesis & significance testing (z test & t test). Excel has all the inbuilt functions to perform these tasks. A Business Analyst should be able to interpret the results and use them to support their findings and insights
- Hands-on experience in one of the ETL tools ” SQL, Python, R, SAS or Alteryx (SQL is one such programming language that can be used across multiple platforms). Most of the bigger enterprises with huge volumes of data operate mostly on SQL
- Excel ” Formulas, Pivot Tables & Charts, Slicers, VBA (good to know, helps in automation)
- Powerpoint
- Effective communication skill to present findings and insights to a larger group
Role of a Data Analyst
I believe a Data Analyst plays the most crucial role in any Decision Cycle chain. Two reasons. One, they are the key lever towards ensuring data is procured, transformed and stored in a way that it is structured and ready to be used. Two, most of the organizations have huge volumes of data that require time and skill to be processed into a useful form . In the example above once, a Business Analyst pass on the data requirements, a Data Analyst works towards procuring, cleaning and integrating the data into the Organization’s dedicated storage areas accessible to different Business Units.
A pharmacy retailer will generate huge volumes of transaction data stored in a non-processed form in some database of their own. Such data sets will contain information pertaining to physicians, patients, stores, medicines and much more. Now the aim of the Data Analyst is to process this data, add necessary information from other relevant tables and create something known as the Analytical Data Set or the ADS. ADS is a key concept in any Analytics industry. Since multiple business units would end up working on similar data set, it is important to create a Single Source of Truth to ensure consistency in numbers reported across the org. Also many times Organizations procure data from a third party vendor, e.g. competitor data. A Data Analyst is responsible for ensuring streamlined integration of such databases in the company’s system.
Requirements for a Data Analyst
- Thorough understanding of Relational Data Base Management System
- Thorough understanding of data sets, the information they contain, their levels (primary and foreign keys) and so on
- Hands-on experience of working with SQL, SAS or any other ETL tool is a must
- Good knowledge of statistics in case a lot of data cleaning needs to be done. Needs to know techniques related to missing value treatment such as basic techniques like mean, median, mode and advanced techniques like K nearest neighbor, spatial clustering & k-means
- SAS has inbuilt functions to run descriptive statistics and clustering algorithms but in scenarios where entire data pre-processing is done in SQL it is important to know one of R or Python
Role of an Advance Analyst
Once the Data Analyst completes the data preparation and a Business Analysts runs some initial deep dives exercise, an Advance Analyst (also known as Data Scientist) is asked to run a segmentation model to identify the cluster of high opportunity Physicians that can be targeted by their Sales Rep. A list of all possible recommended variables are provided to the Advance Analyst based on which they are expected to run the model and produce the final recommendation.
In this use case, once the Patient, HCP, Script, Competitor level data sets are generated, the Business Analyst will perform a basic overview of how the existing business scenario looks across different geographies. A list of high opportunity geographies will be recommended on which the Advance Analyst will run their models and create the final recommended list.
Requirements of an Advance Analyst
- In-depth understanding of Machine Learning techniques, most importantly the algorithm and the mathematics behind them. We often ignore the concepts of linear regression, logistic regression, a decision tree or a neural network because most of the platforms offer functions that can produce the result within a span of time. However, knowing the mathematics allows you to slice and dice the data to achieve the desired results
- Often results in any modeling exercise doesn’t turn up the way you see in most of the tutorials. At times it’s hard to interpret the results and make business sense out of them hence some business acumen of the market is useful
- Hands-on experience of working with SAS, R or Python
- Business stakeholders are not much familiar with statistics hence a good communication skill is required to translate the theta values into business actions
Role of a Visualization Analyst
A Visualization Analyst comes to picture towards the later part of the projects after the initiative is rolled out. Once the Sales Representatives starts targeting the Physicians it’s time to do some impact assessment and what better than creating a Dashboard which tracks every performance indicator in one place.
Most of the organizations these days are avoiding working in silos. Hence previously a trend that involved multiple reports for different Business Units is slowing anchoring into a 360 dashboard of a sort. Hence Visualization Analysts are in demand because they know the art of creating the finest dashboard in town. In this case, once Business decides to track their ROI (Return on Investment) they ask the Visualization Analyst to create a dashboard that represents summaries to the granular form.
Requirements of a Visualization Expert
- Thorough knowledge of one of the following Power BI, Tableau or Qlik Sense (sometimes HTML)
- Tableau is ruling the market currently however Organizations are slowly adopting Qlik Sense as well. Qlik Sense is considered as a Self Service dashboard with ETL capabilities and faster data processing. A self service dashboard is defined as a platform where non-Visualization experts can just drag and drop to create summaries, charts, filters, etc. A QVD or a Qlikview Data has lower processing time and resides in the Qlik architecture ensuring easy maintenance
Now that you know how different entities function, I recommend you think what interests you and chose a online curriculum accordingly rather than jumping directly into any online course. You can go through this article 50 Years of Data Science by David Donoho in case you want a detailed information on the history and future of Data Science industry.