


One of the biggest talking points of the current generation is the concept of data. Data is the most valuable item in today’s day and will remain so in the foreseeable future. Every piece of information that is obtainable can be utilized to create more effective products with better technology for higher customer satisfaction. Data lakes and data visualization are two such technologies that enable us to utilize this data more productively.
Data Lakes and Data Visualization
Data lakes are an impeccable development that offer a high amount of utility. These systems are huge repositories of data in which most data elements are stored in their natural raw formats. The data in these lakes are usually stored as objects. They store structured data in the form of relational databases, semi-structured data (typically excel sheets), and unstructured data.
Data lakes are useful for performing a variety of advanced operations. Some of these computations include data analytics, machine learning, artificial intelligence, and data visualization. Let us now understand data visualization with a brief description.
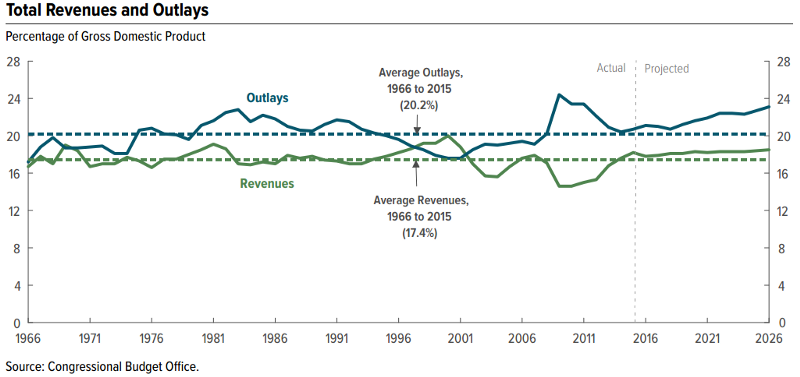
Data visualization is one of the most significant steps involved in combating a large amount of data. The first phase of managing data is with the help of exploratory data analysis. Data visualization is the process of converting available data into useful graphs or any sort of visuals. Through data visualization, it becomes easier to analyze large amounts of data for a particular project. Furthermore, this translation of data into visual format assists developers in finding useful patterns to approach the specific task.
This translation of large data into charts, graphs, and other visuals helps developers identify crucial real-time information, outliers in information, and new insights to solve particular problems. Usually, a dashboard is utilized as the main visualization tool to analyze critical data and monitor them accordingly.
Improving Data Visualization with Data Lakes

Data lakes are a powerhouse for the storage of data and useful information. By combining data lakes and data visualization, we can create data lake visualization (DLV). These visualizations act as a one-stop data visualization platform for tackling most available open-source datasets on cloud platforms. We can handle most of the available data through advanced automatic visualization techniques, such as dragging and dropping 2-D or 3-D models for high-level visuals.
Data visualization is mostly layered above data lakes for gaining fast and insightful information. These visualization techniques work best when paired with a technology that supports them effectively, and most modern data lake systems have a wide array of tools to enable efficient visualization.
The streamlined pipes of data lakes help view and process information for faster data visualization. Most complex products require the combination of these two fabulous strategies to obtain the best results. Let us understand their usage in the next section.
Understanding Their Usage
For explaining the usage, I will take the help of an example. Let us study the following case from Mississippi.
One of the best uses of data lakes and data visualizations in recent times can be seen in the innovative approach that was used to solve the challenges of access to healthcare in Mississippi. An article published on this topic covers how they designed, constructed, and managed a data lake service to collect and store large amounts of useful data and information. All the collected information was ultimately used for data visualization to track maps, geographies, and data marts.

In order to solve the issue of healthcare access in Mississippi, the proposed method was to construct a centralized repository and make use of a scalable informatics platform such as a data lake service. The next step for resolving the problem was to set up and develop a data management solution for the data lakes platform. The final step was to make use of data visualization and analysis to derive the best utility from the data lakes platform.
Data lakes were used for the purpose of saving time, bypassing some limitations of traditional data warehouses, and making use of data visualization. In addition, a geographic information system (GIS) web application was developed for mobile devices to explore the demographics. The results obtained using these methodologies were highly positive and an enormously profitable venture. This project shows the vast potential that the combination of data lakes and data visualization possesses.
Conclusion
Data lakes are one of the most useful technologies to be developed in recent times. They act as a centralized repository for performing cross-functional analysis and multiple other tasks. With the right data visualization tools and methodologies, usage of the data stored in these lakes is more effective and easier. They also obtain the most productive results.

