


In 2004, GPS technology combined with map viewing interfaces (TomTom GO being the forerunner for it) facilitated the arrival on navigation devices’ market. (1)
Later in 2005, Google launched the web mapping product, Google Maps. And months later, the company sets in motion the Google Maps API that allows developers to embed Google Maps into an external website, onto which site-specific data can be overlaid.
This location technology has assisted millions, intrepid tourists, alley-hidden coffee shop owners, traffic gridlock commuters and even property haunters. The latter allows users to get very specific about their property requirements and quickly locate the exact properties they search for. This includes everything from ideal square footage, demographic data, proximity to areas of interest and so on.
What’s interesting is that brokers and brokerages may already use the Google Maps API even without realizing it. So, why not take advantage of the data to know precisely how much impact specific points of interest (POI) can help increase property values or rental yield?
In this article, we establish a correlation between the price of several Seattle properties and the POI in their vicinity:
Data Sources
The dataset was created by our team using Python packages requests (this request module allows you to send HTTP requests using Python), Selenium to scrape sources such as Zillow for real estate listings and Google Places API for Points of Interests close to these estates and positional information.
The POIs we want to get are the ones not further than a mile away from the estate.
You can find the data used in this article and much more in the GitHub links below:
Workflow
-
We scrape accurate listings data from Zillow.
-
We use our google_api.py script to fetch the POIs not further than a mile away from each estate scraped in the previous point. And for this, we use the Google Place API endpoint “nearby search (https://maps.googleapis.com/maps/api/place/nearbysearch/).
-
We save the POIs in an array and attach them.
-
We use formatter.py’s get_estate function to format our .json estates’ data into a CSV; this code will also add three data columns representing the closest point of interest to that estate, its latitude, and its longitude coordinates.
-
We use formatter.py’s get_POIS function to order POIs by their type.
-
We run data_processing.py to create maps and tables.
Â
Hypothesis
1. Combination of location technology and data analysis allows the user to locate relevant points of interest that can possibly impact the pricing of real estate.
2. Sometimes, there is a correlation between the price of a property and the points of interest in the vicinity.
Analysis
First, we took the data obtained by scraping Zillow‘s listings in Seattle & Google Places API and processed it with our data_processing.py script to get a graphic representation of the total concentration of property for sale in the Seattle area.
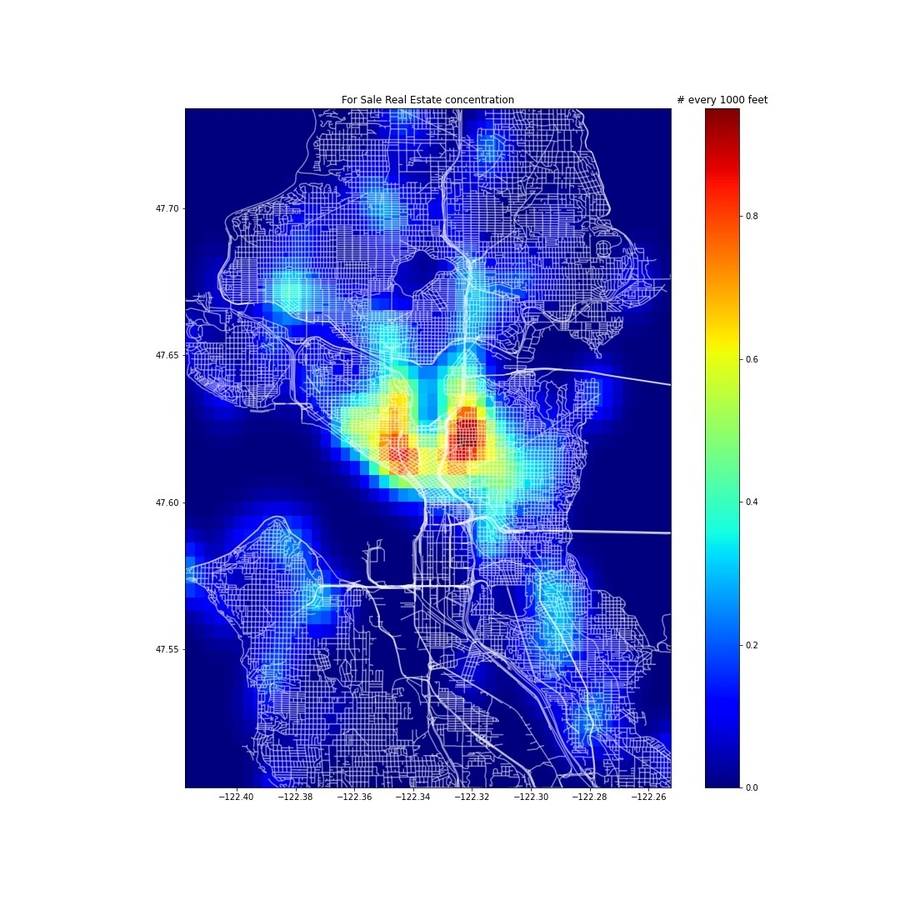
Figure 1. The total concentration of property for sale in the Seattle area.
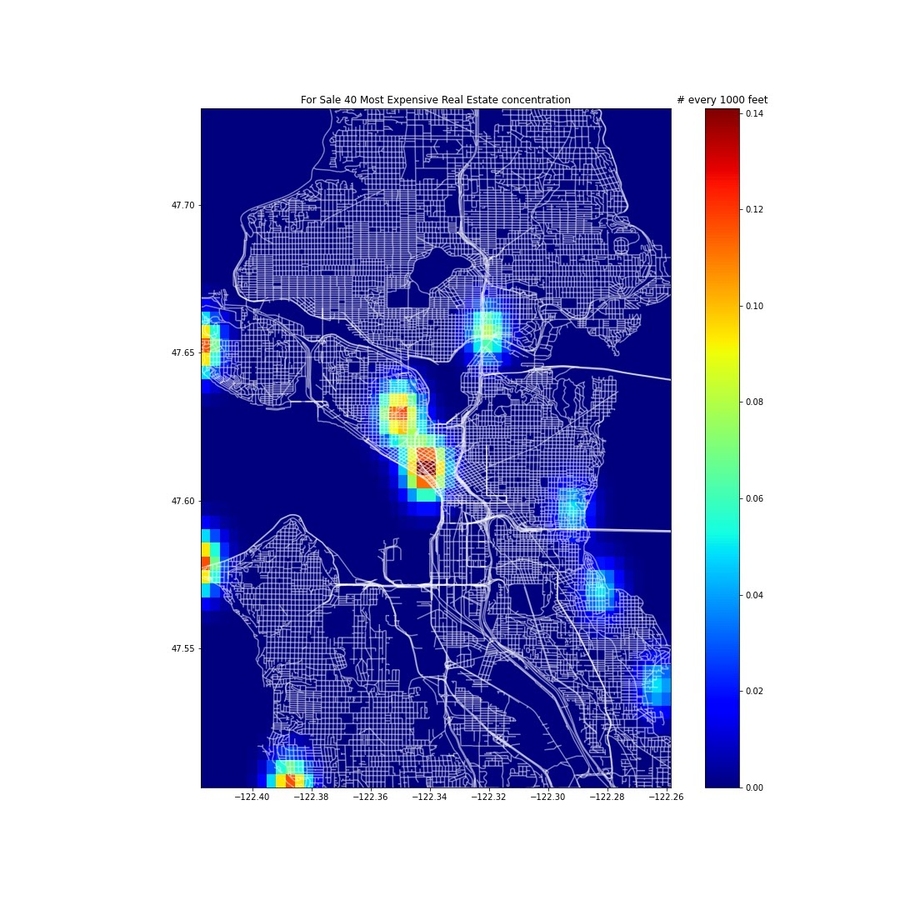
Next, we apply the same process to reach the concentration of most expensive properties for sale ( > 2 million USD). We got this information by sorting our estate listings dataset by a most significant value.
Figure 2. Concentration of 40 most expensive properties for sale in Seattle ( > 2 million USD)
We also used data_processing.py to construct Table 1, ranking the top 20 most expensive real estate properties for sale in that particular studied area. The list also shows how many bedrooms and bathrooms these properties have and their selling price, the data of which we obtained from Zillow. Additionally, to construct the last column of Table 1, we scrape data from Google Places API. Finally, by analyzing the results, we can see that the most common point of interest is high-end properties in Seattle bars.
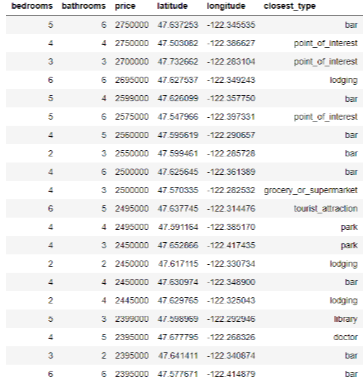
Table 1. Some characteristics of the top 20 most expensive real estate for sale. Note that the closest_type column represents the closest point of interest to that real estate.
Are there many bars located nearby high-end areas? Let’s take a look at the concentration of bars…Â
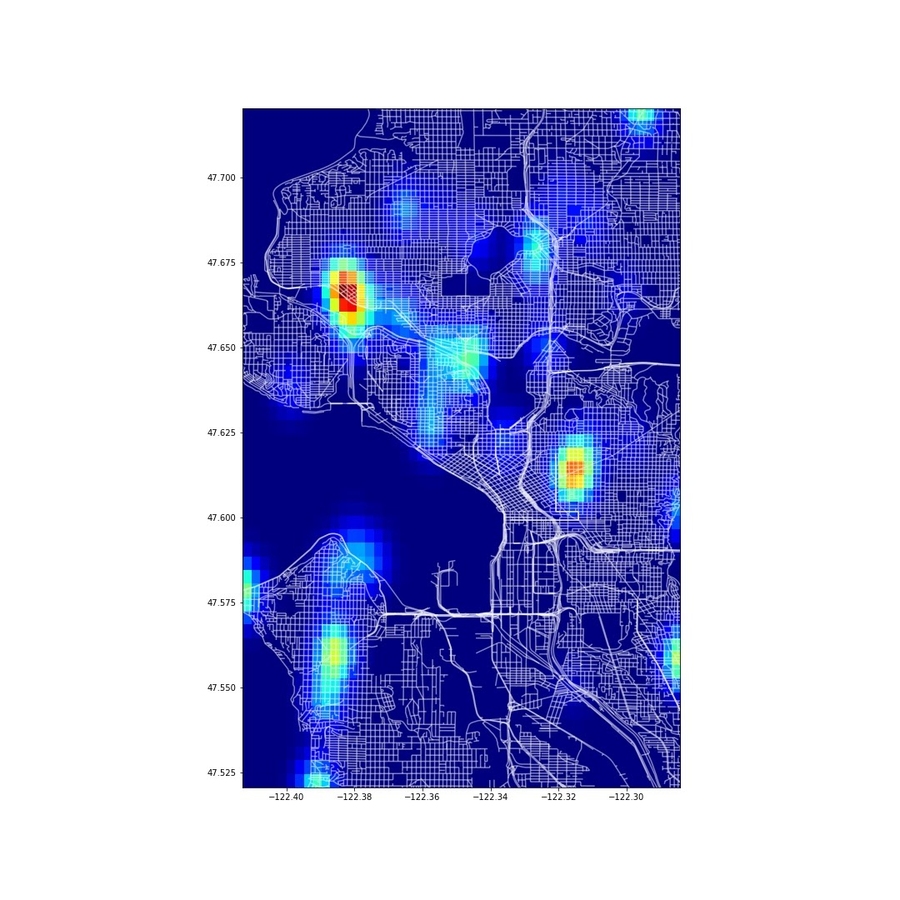
Figure 3. The total concentration of bars in Seattle. By comparing this heatmap to the map in Figure 2, we can spot some correlation in two locations, just as our table showed us previously.
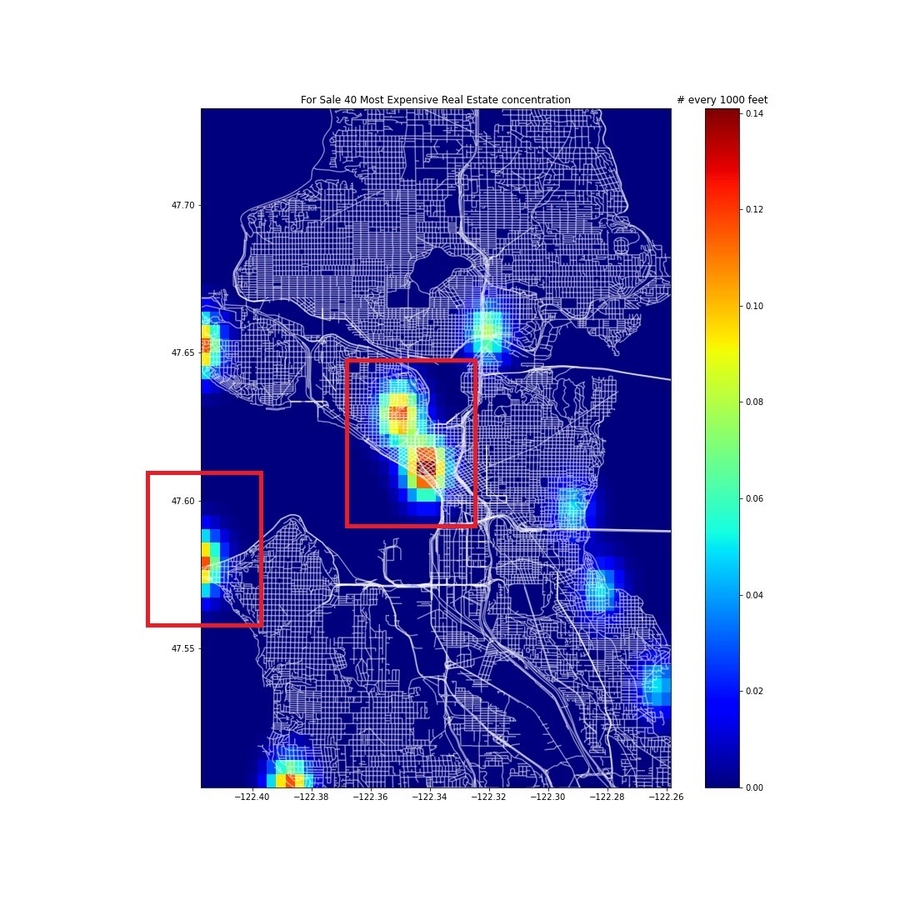
Figure 4. Areas where >2 million USD properties and a considerable concentration of bars nearby coincide.
Could this be the same for low-end properties? Let’s take a look.
We applied the same steps we used to obtain Figure 2. But this time, we searched for the least expensive properties in Seattle.
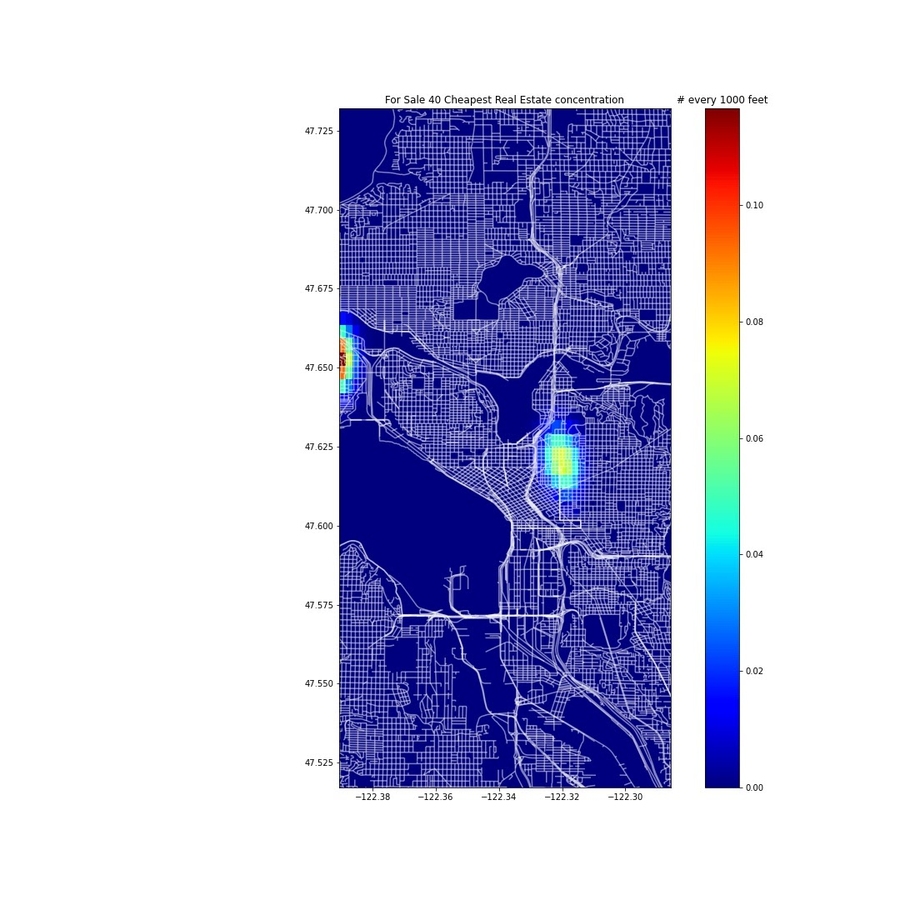
Figure 5. The concentration of least expensive properties for sale in Seattle.
This time, we created Table 2 repeating the steps described previously, ranking the top 20 least expensive real estate properties for sale (showing how many bedrooms and bathrooms they have and their selling price) and added a column with the closest POI.
Table 2. Some characteristics of the top 20 least expensive real estates for sale. Note that the closest_type column represents the closest point of interest to that real estate.
The most common closest_type in Table 2 is lodging facilities. Our heatmap results should represent something similar to our previous case. Let’s check it.
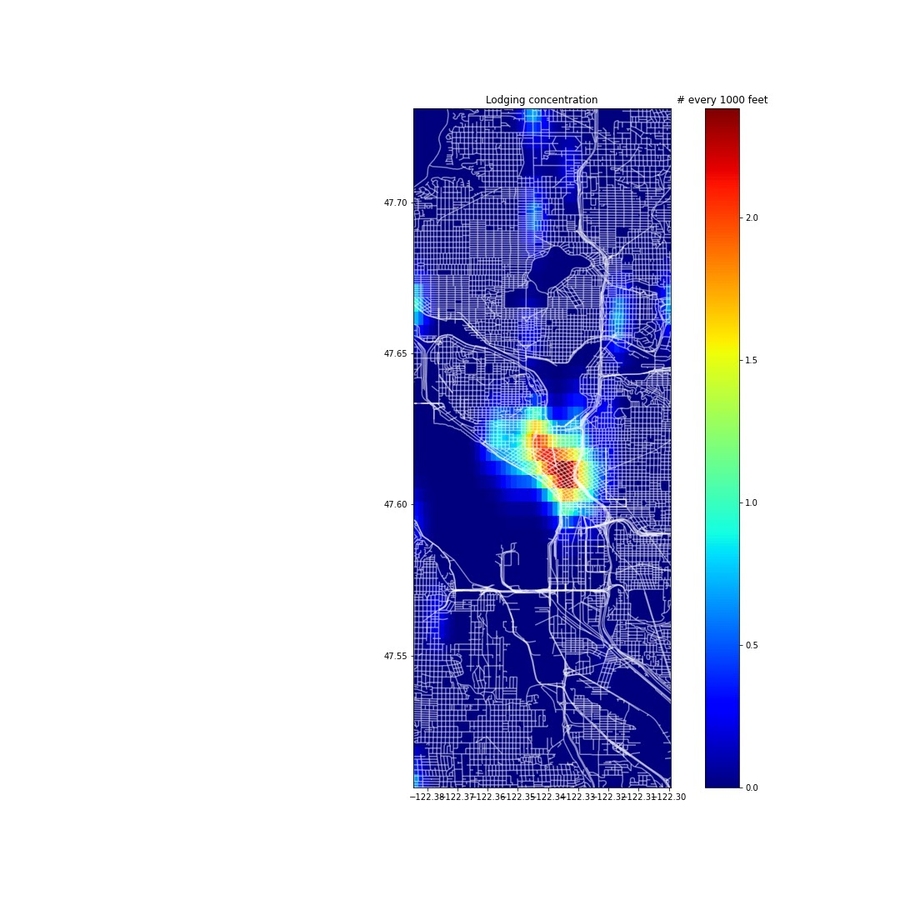
Figure 6. The total concentration of lodging facilities in Seattle is represented on a heatmap.
If we repeat the comparison process of our previous case, we can spot some correlation on the heatmaps. Take a look at our low-end property concentration heatmap:
Figure 7. Areas where the least expensive properties and lodging facilities are in proximity.

Furthermore, we could use this data for more specific indexing. For example, we were Real State hunters, and we’re looking for an affordable property with at least three bedrooms, within a mile of a primary school, but we or our client, are on a budget. So, we’d like to filter properties that cost more than 1.000.000 USD. We’d like to know the prices of such properties and their location to input these coordinates in our GPS to visit the estate.
For this, we check our full table that represents for real estate sale (sale_data.csv), load it into a DataFrame using Python’s Pandas library, and input the following code:
>>> df = pd.read_csv(‘csvs/sale_data.csv’)
>>> df = df[df[‘closest_type’] == ‘primary_school’]
>>> df = df[df[‘bedrooms’] >= 3]
>>> df = df[df[‘price’] < 1000000]
There are five properties with the characteristics we’re looking for and we have the latitude and longitude coordinates; so we can take a look at them.
Summary: How can you benefit from this type of analysis
It is safe to say that the attributes of residential location, such as the proximity to the place of employment, accessibility to health establishments and even neighbourhood businesses, are among the major factors that determine not just the price of the house, but also the kind of potential buyer who is interested in them.
Realtors benefit greatly from this type of analysis. Most companies develop and curate huge datasets with tons of properties in the market; so, it’s easier to pinpoint a property a client may be interested in.
Location technology serves as a potential tool for developers, realtors, brokers and clients to make informed, intelligent and confident decisions about their real estate investments. From POI nearby to demographic statistics, the variables to study and analyze are close to endless.
References
https://hellofuture.orange.com/en/you-are-here-a-brief-history-of-geolocation/
Code
https://github.com/Mindtrades-Consulting/Location-technologies-and-their-usage-in-real-estate
For more information, click mindtrades.com
