


The core purpose of the Tableau Prep Builder is data preparation. The good news is, Prep is fully compatible with Tableau Desktop, and also with Tableau Server. That means you can execute jobs in Prep to clean your data with the click of a button. Additionally, Prep is as visual as its big brother, Tableau Desktop, meaning that you can see every step of data preparation in a fully visual format.
This article is an excerpt from the book Mastering Tableau 2021, Third Edition by Marleer Meier and David Baldwin. This book is a complete guide to build, design, and improve advanced business intelligence solutions using Tableau’s latest features, including Tableau Prep Builder, Tableau Hyper, and Tableau Server.
This article focuses on getting started with Tableau Prep Builder and the most important feature of preparing and cleaning data. Cleaning the data is a crucial aspect that impacts analytics and decision making.
The Tableau Prep Builder Graphical User Interface (GUI)
User experience is an important topic, not only when you build a dashboard but also when you use other aspects of Tableau.
The Tableau Prep Builder GUI has two important canvases to look at. Right after you have connected data to Tableau Prep Builder, the workspace will split into several parts:

Figure 1: Prep workspace sections
- A: The connection pane, showing you the input files available at the location selected.
- B: The flow pane, which shows your current Prep flow. This always starts with an input step.
- C: The input pane settings, which give you several options to configure your input.
- D: The input pane samples, showing the fields you moved to the connection pane, including sample values.
In the input pane (the section marked with C) you can use the wildcard union (multiple files) function to add multiple files from the same directory. Also, you can limit the sample set that Tableau Prep Builder will print to increase performance. In the input pane samples (the section marked with D) you can select and deselect the fields you want to import and change their data types. The data type options are, for example, strings, dates, or numbers.
The second GUI is the profile pane. Once you have selected the input data needed, click on the + in the flow pane and select Add: Clean Step. Now the profile pane will appear:
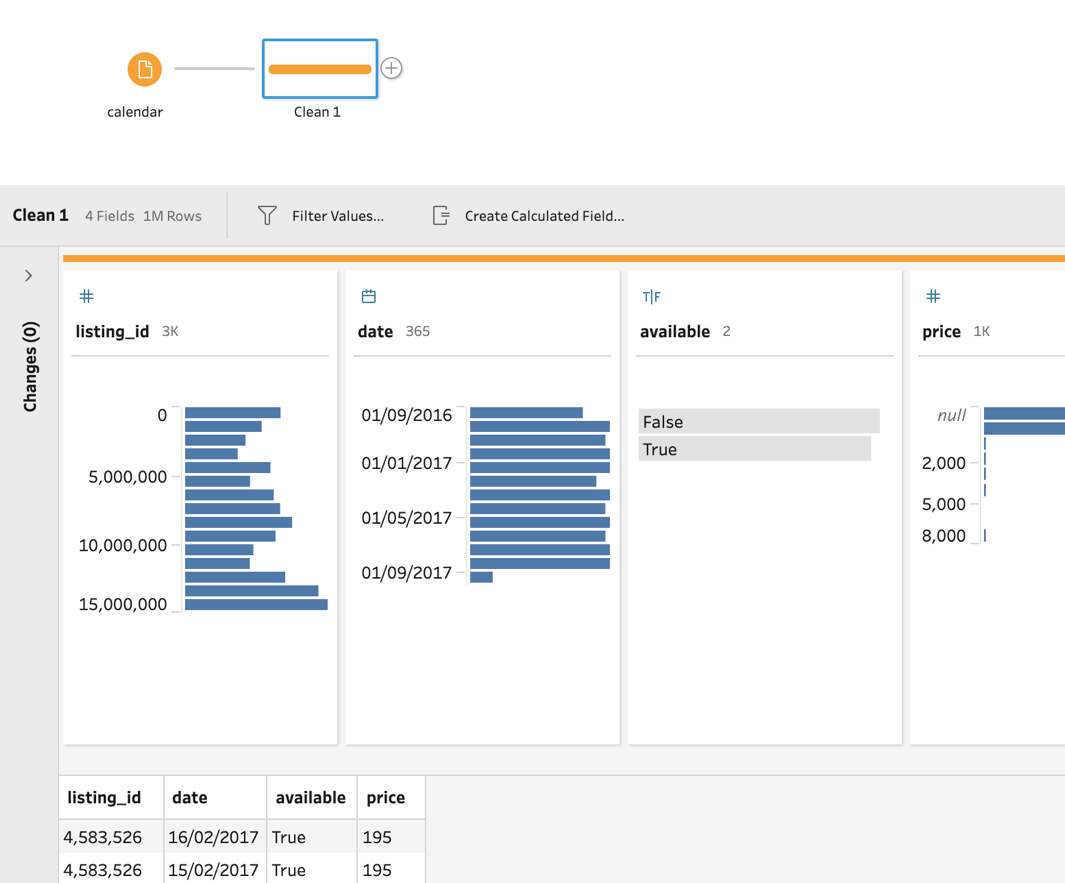
Figure 2: Cleaning data
In the preceding screenshot, the profile pane shows every column from the data source in two sections. The upper sections show aggregates. For example, column 2, date, shows the number of rows per date in a small histogram. The columns can all be sorted by clicking on the Sort icon (a mini bar-chart that appears when your mouse is hovering over a column) next to the column name and by selecting one item. Let us take, for example, True, in available (column 3). All related features will be highlighted:
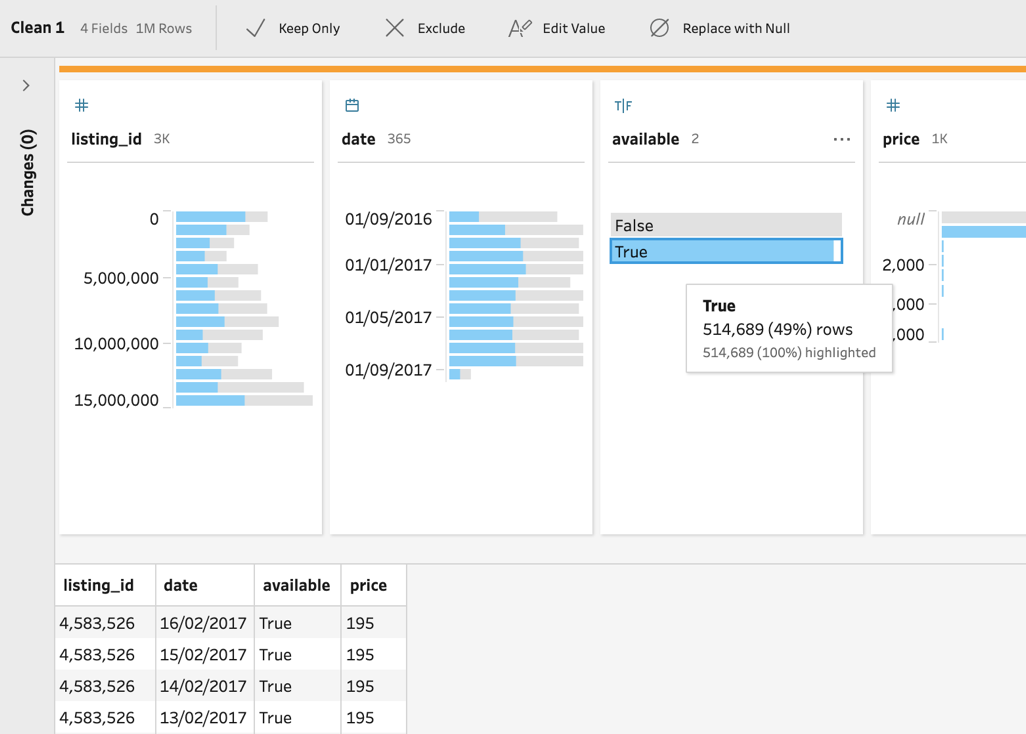
Figure 3: Visual filtering
This gives you the chance to get some insights into the data before we even start to clean it up. In the following screenshot, each row is shown as it is in the data source in the lower part of the profile pane:

Figure 4: Data overview
So far, we have seen that, after loading data in Prep, visual filters can be applied by clicking on a field or bar in one of the columns. The lower pane will always show the data source of the selection made at the row level. Next, we will continue by adding more data sources.
Prepping data
Tableau Prep Builder comes with lots of distinctive features. Sometimes you might use many different tools to prepare your dataset in order to get it in the shape you desire. Other times you might just run an aggregation (one feature) and be done. It really depends on the dataset itself and the expected output. The fact is, the closer your Prep output data is to what you need for your Tableau Desktop visualization, the more efficiently VizQL will run on Tableau Desktop. Fewer queries in Tableau Desktop means faster generation of dashboards.
To me, the best part about Tableau Prep Builder is that it can handle a huge amount of data. Sometimes I even use it for datasets I don’t want to visualize in Tableau Desktop, just to get a quick overview of, for example, how many rows contain a specific word, how many columns are needed, what happens to the date range if I filter a particular value, and so on! Within a few minutes I have insights that would have taken me much more time to get with database queries or Excel functions. I hope that by the end of this chapter you will be able to cut your time spent data prepping in half (at least).
We will divide the prepping features into five subcategories: cleaning, unions and joins, aggregating, pivoting, and scripting. In this article we will take up Cleaning Data.
Cleaning data
We have seen the following canvas before in the The Tableau Prep Builder GUI section. To create the cleaning step, the user can simply click on + next to the input and select Add: Clean Step. During the cleaning step, multiple operations can be performed, such as filtering or creating a calculated field. Also note the recommendations Tableau Prep Builder gives you:
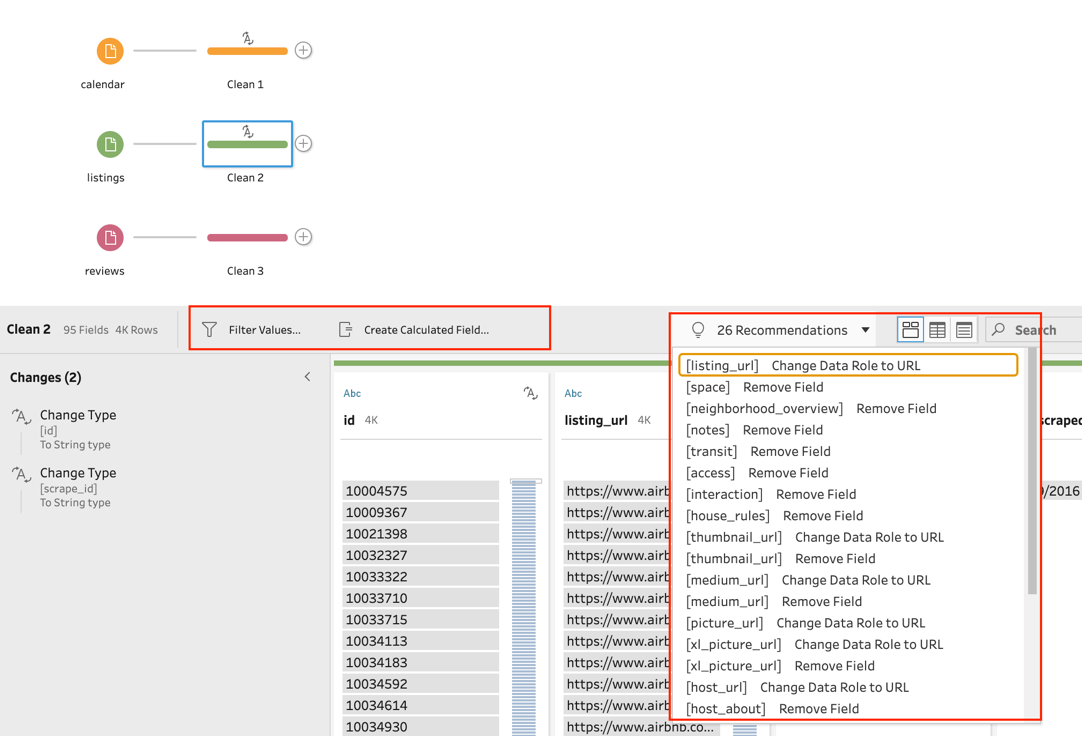
Figure 5: Recommendations
Tableau Prep Builder analyzes the column content and proposes changes that might fit the data. The column listing_url for example is being recognized as a webpage and therefore Prep recommends you change it to the data role URL. The second, third, and several more recommendations after listing_url are to remove certain columns. This is probably the case because the column does not contain any data or contains only a small amount of data. The list goes on.
This feature can be useful, especially for unfamiliar datasets. My way of working would be, look at the recommendations, check if they make sense, and execute the change ”or not. Don’t blindly trust these recommendations, but they can point out data flaws you might have missed otherwise.
Data is often messy, involving null values, typos from manual entries, different formatting, changes in another system, and so on. As a consequence, you will have to sort out the mess before you can get reliable results from an analysis or a dashboard. This section will show you how to clean data on a column level.
Once a value is selected within your clean step, you have the option to Keep Only, Exclude, Edit Value, or Replace with Null:
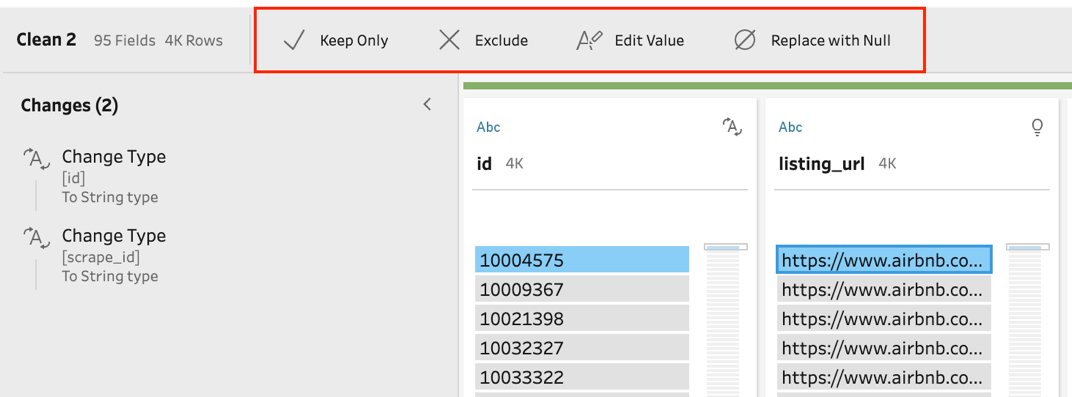
Figure 6: Quick access
None of these changes will change the data source itself. Prep is like an in-between step, or a filter between the original data source and your Tableau Desktop. Excluding a value, as highlighted in Figure 6, will only remove it from Tableau Prep Builder. However, if used later as input for Tableau Desktop, there won’t be an option to add that specific value back in. This option will remain in Tableau Prep Builder only.
Another slightly hidden option is to click on the ellipses (…) next to the column headers (as shown in Figure 7) and select Clean:
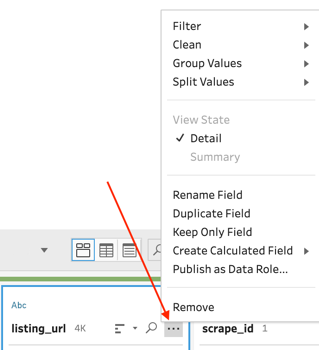
Figure 7: More options
This Clean functionality operates based on the data type of the column. In the preceding screenshot, the data type is a string (indicated by the Abc icon). For other data types, the option will be greyed out since Clean is only available for strings. The option allows you to make use of eight more cleaning features:

Figure 8: Selecting Clean
The data type can be changed just above each column header; you will find a symbol above the column name, which can be changed by clicking on it, just like in Tableau Desktop:
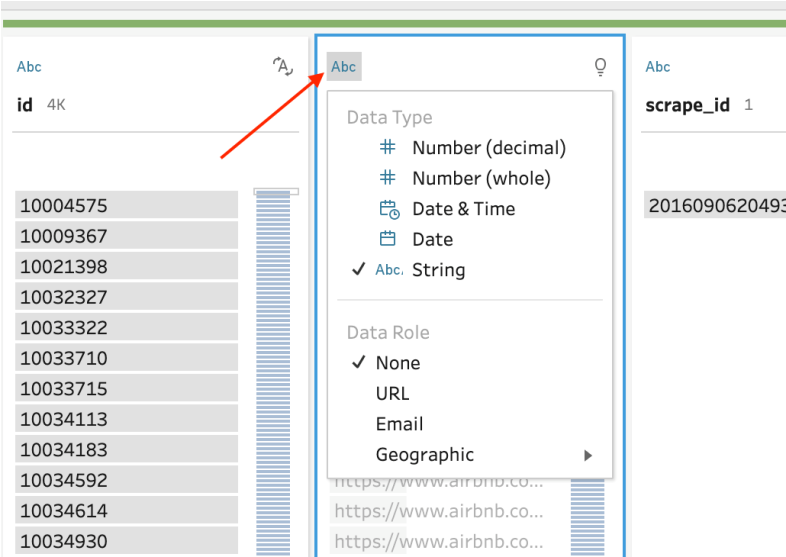
Figure 9: Changing Data Type
This comes in handy in case Prep misinterprets the data type of a column. A wrongly assigned data type can have effects on the calculation you perform on them and how Tableau Desktop would visualize the column.
About
Marleen Meier has been working in the field of data science since 2013. Her experience includes Tableau training, proof of concepts, implementation, enablement as well as quantitative analysis, machine learning and AI. In 2018, she was a speaker at the Tableau conference, where she showcased an anomaly detection model using neural networks, visualized in Tableau.
David Baldwin has been providing consulting in the business intelligence sector for 22 years. His experience includes Tableau training and consulting, developing BI solutions, project management, technical writing, and web and graphic design. His vertical experience includes financial, healthcare, human resources, aerospace, energy, education, government, and entertainment industries.
