



While the technologies and techniques for analyzing, aggregating, and modeling data have largely kept pace with the demands of the modern data organization, our ability to tackle broken data pipelines has lagged behind. So, how can we identify, remediate, and even prevent this all-too-common problem before it becomes a massive headache? The answer lies in the data industry’s next frontier: data observability.
When you were growing up, did you ever read a Choose Your Own Adventure novel? You, the protagonist, are responsible for making choices that will determine the outcome of your epic journey, whether that’s slaying a fire-breathing dragon or embarking on a voyage into the depths of Antarctica. If you’re in data, these adventures might look a little different:
The Data Analyst Quest
It’s 3 a.m. You’ve spent the last four hours troubleshooting a data fire drill, and you’re exhausted. You need to figure out why your team’s Tableau dashboard isn’t pulling the freshest data from Snowflake so that Jane in Finance can generate that report ¦ yesterday.
The Data Engineering Escape
You’re migrating to a new data warehouse and there’s no way to know where important data lives. Redshift? Azure? A spreadsheet in Google Drive? It’s like a game of telephone trying to figure out where to look, what the data should look like, and who owns it.
The Data Scientist Caper
It takes 9 months of onboarding before you know where any of your company‘s good data lives. You’ve found so many FINAL_FINAL_v3_I_PROMISE_ITS_FINAL versions of a single data set that you don’t know what’s up and what’s down any more, let alone don’t know which data tables are in production and which ones should be deprecated.
Sound familiar?
Before we dive into how to fix this problem, let’s talk about the common cause of broken data pipelines: data downtime.
The rise of data downtime
In the early days of the internet, if your site was down, it was no big deal Š ” Šyou’d get it back up and running in a few hours with little impact on the customer (because, frankly, there weren’t that many and our expectations of software were much lower).
Flash forward to the era of Instagram, TikTok, and Slack Š ” Šnow, if your app crashes, that means an immediate impact on your business. To meet our need for five nines of uptime, we built tools, frameworks, and even careers fully dedicated to solving this problem.
In 2020, data is the new software.
It’s no longer enough to simply have a great product. Every company serious about maintaining their competitive edge is leveraging data to make smarter decisions, optimize their solutions, and even improve the user experience. In many ways, the need to monitor when data is down and pipelines are broken is even more critical than achieving five nines. As one data leader at a 5,000-person e-commerce company recently told me: it’s worse to have bad data on my company’s website than to not have a website at all.
In homage to the concept of application downtime, we call this problemdata downtime, and it refers to periods of time where your data is missing, inaccurate, or otherwise erroneous. Data downtime affects data engineers, data scientists, and data analysts, among others at your company, leading to wasted time (north of 30 percent of a data team’s working hours!), sunk costs, low morale, and perhaps worst of all, lack of trust in your insights.


Here are some common sources of data downtime Š ” Šmaybe they’ll resonate:
- More and more data is being collected from multiple sources. As companies increasingly rely on data to drive decision making, more and more data is being ingested, often to the tune of gigabytes or terabytes! Very often these data assets are not properly monitored and maintained, causing problems down the road.
- Rapid growth of your company, including mergers, acquisitions, and reorganizations. Over time, data that is no longer relevant to the business is not properly archived or deleted. Data analysts and data scientists don’t know what data is good and what data can go the way of the Dodos.
- Infrastructure upgrades and migrations. As teams move from on-prem to cloud warehouses, or even between cloud warehouse providers, it’s common to duplicate data tables to avoid losing any data during the migration. Issues arise when you forget to cross-reference your old data assets with your new, migrated data assets.
With the increased scrutiny around data collection, storage, and applications, it’s high time data downtime was treated with the diligence it deserves.
The solution: data observability
Data observability, a concept pulled from best practices in DevOps and software engineering, refers to an organization’s ability to fully understand the health of the data in their system. By applying the same principles of software application observability and reliability to data, these issues can be identified, resolved and even prevented, giving data teams confidence in their data to deliver valuable insights.
Data observability can be split into five key pillars:

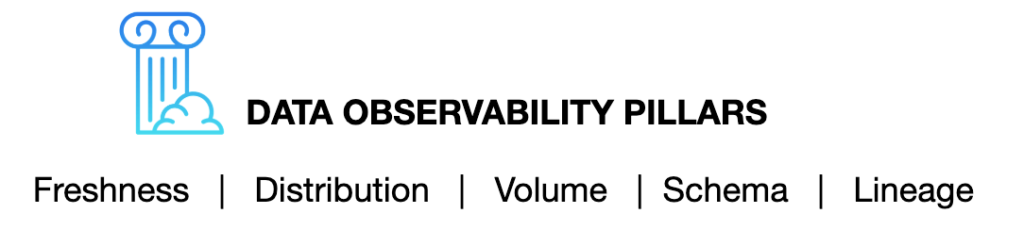
- Freshness: When was my table last updated? How frequently should my data be updated?
- Distribution: Is my data within an accepted range?
- Volume: Is my data complete? Did 2,000 rows suddenly turn into 50?
- Schema: Who has access to our marketing tables and made changes to them?
- Lineage: Where did my data break? Which tables or reports were affected?
Data observability provides end-to-end visibility into your data pipelines, letting you know which data is in production and which data assets can be deprecated, thereby identifying and preventing downtime.

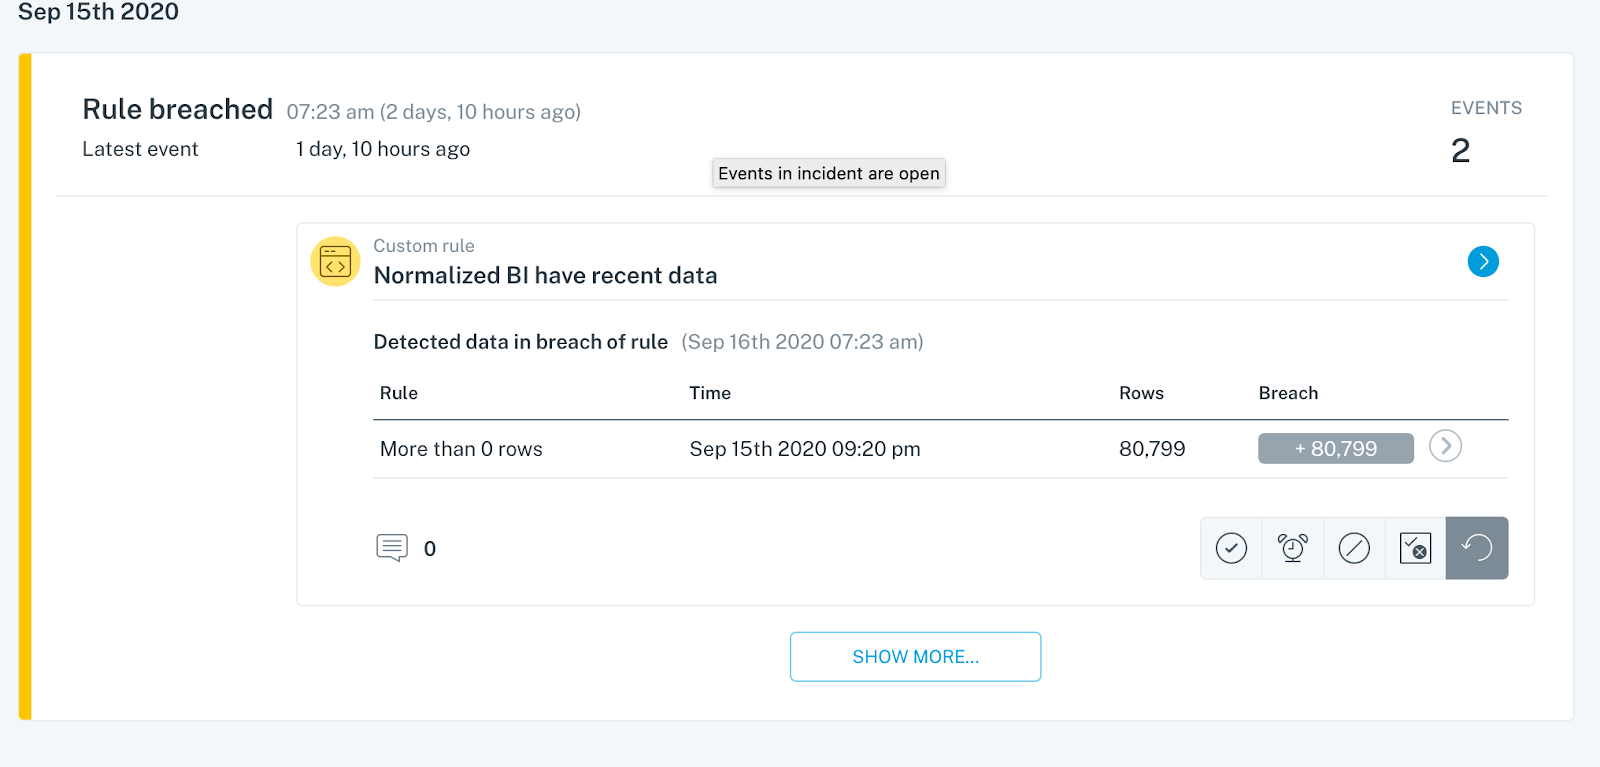
A robust and holistic approach to data observability incorporates:
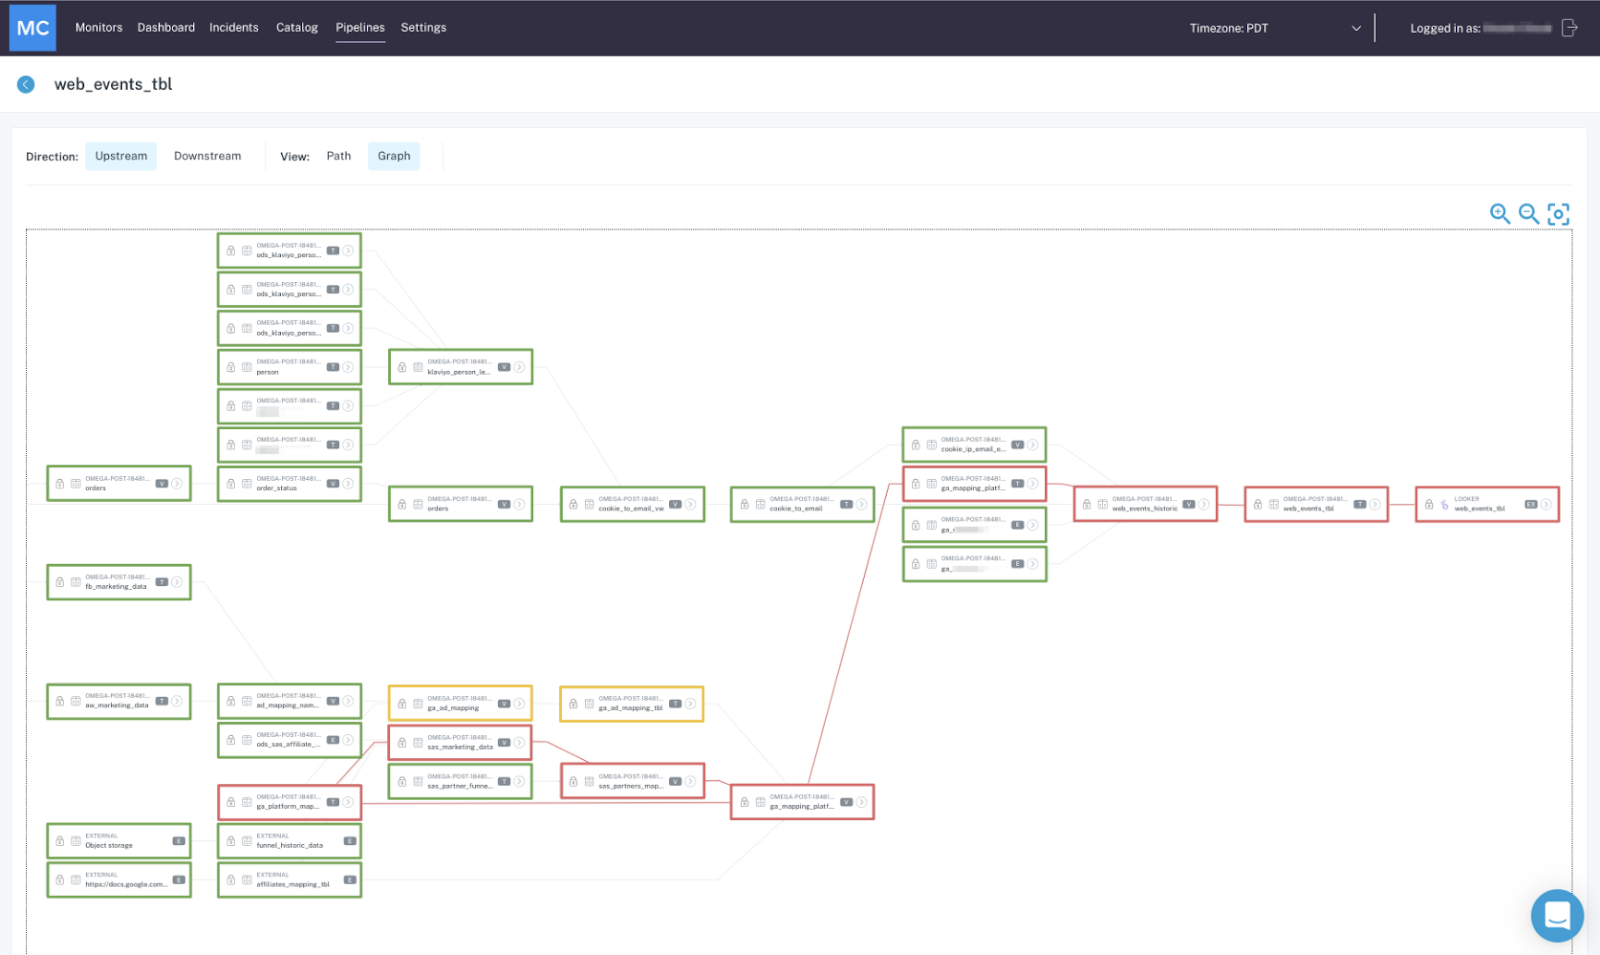
- Metadata aggregation & cataloging. If you don’t know what data you have, you certainly won’t know whether or not it’s useful. Data catalogs are often incorporated into the best data observability platforms, offering a centralized, pane-of-glass perspective into your data ecosystem that exposes rich lineage, schema, historical changes, freshness, volume, users, queries, and more within a single view.
- Automatic monitoring & alerting for data downtime. A great data observability approach will ensure you’re the first to know and solve data issues, allowing you to address the effects of data downtime right when they happen, as opposed to several months down the road. On top of that, such a solution requires minimal configuration and practically no threshold-setting.
- Lineage to track upstream and downstream dependencies. Robust, end-to-end lineage empowers data teams to track the flow of their data from A (ingestion) to Z (analytics), incorporating transformations, modeling, and other steps in the process.
- Both custom & ML-generated rules. We suggest choosing an approach that leverages the best of both worlds: using machine learning to historically monitor your data at rest and determine what rules should be set, as well as the ability to set rules unique to the specs of your data. Unlike ad hoc queries coded into modeling workflows or SQL wrappers, such monitoring doesn’t stop at field T in table R has values lower than S today.
- Collaboration between data analysts, data engineers, and data scientists. Data teams should be able to easily and quickly collaborate to resolve issues, set new rules, and better understand the health of their data.

With these guidelines in tow, data teams can more effectively manage and even prevent data downtime from occurring in the first place.
So Š ” Šwhere will your data adventure take you?
Interested in learning more about data observability for your organization? Reach out to Barr Moses and the rest of the Monte Carlo team.