

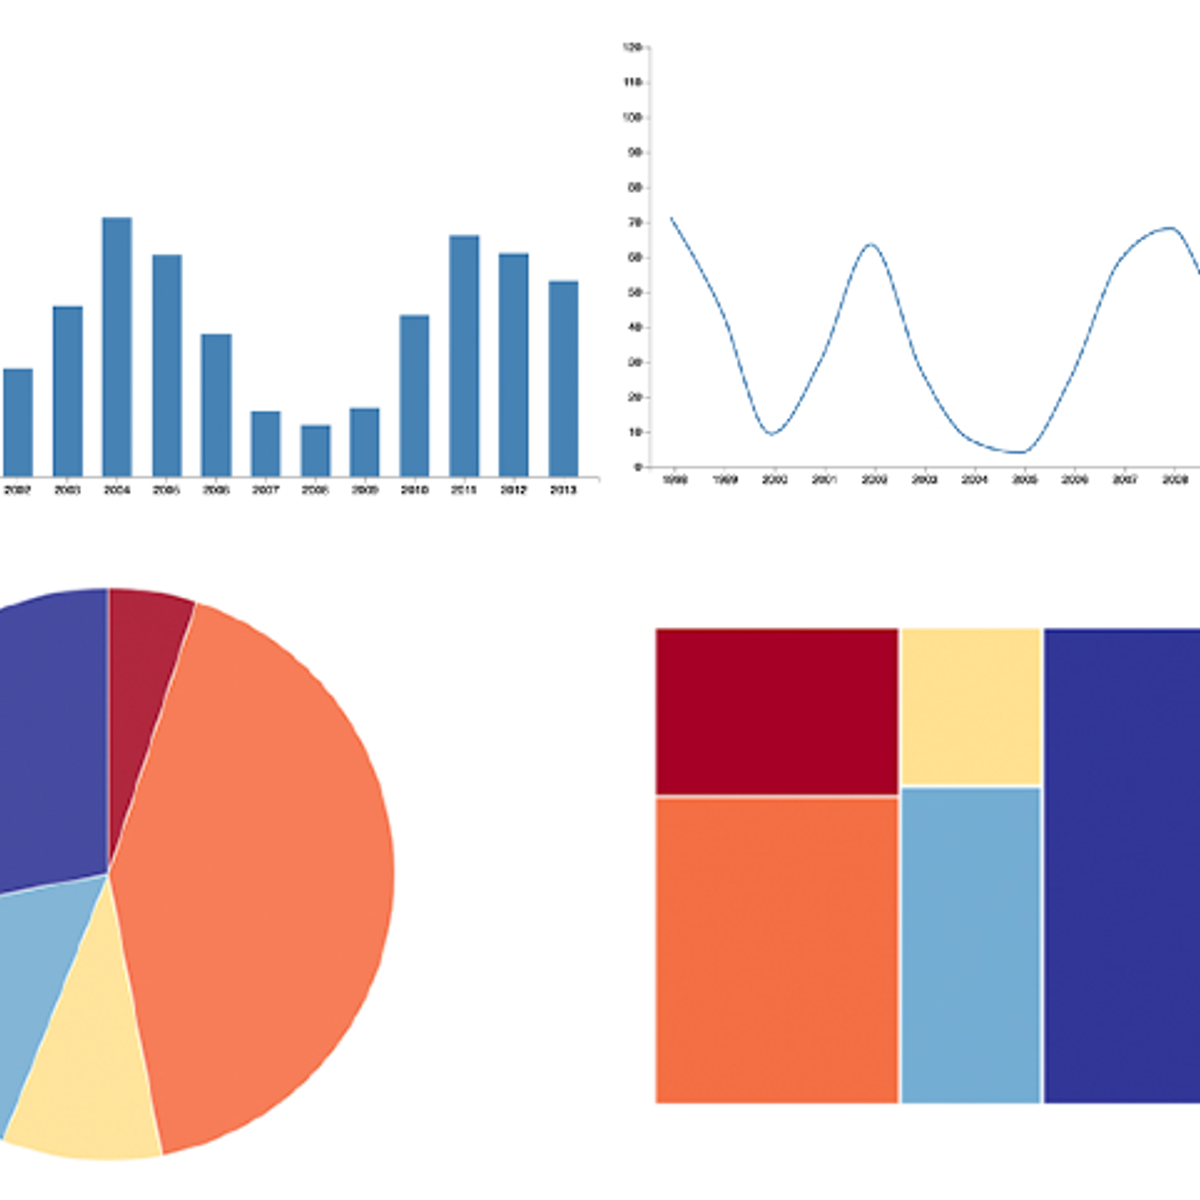
Data is everywhere. Charts, graphs, and other types of information visualizations help people to make sense of this data. This course explores the design, development, and evaluation of such information visualizations. By combining aspects of design, computer graphics, HCI, and data science, you will gain hands-on experience with creating visualizations, using exploratory tools, and architecting data narratives. Topics include user-centered design, web-based visualization, data cognition and perception, and design evaluation. This course can be taken for academic credit as part of CU Boulder’s Master of Science in Data Science (MS-DS) degree offered on the Coursera platform.
The MS-DS is an interdisciplinary degree that brings together faculty from CU Boulder’s departments of Applied Mathematics, Computer Science, Information Science, and others. With performance-based admissions and no application process, the MS-DS is ideal for individuals with a broad range of undergraduate education and/or professional experience in computer science, information science, mathematics, and statistics. Learn more about the MS-DS program at https://www.coursera.org/degrees/master-of-science-data-science-boulder.
