


The computer has always been king when it comes to calculation and processing huge amounts of data, but simple skills that humans master early in life, like understanding language or recognizing objects continue to baffle researchers. The dream of building a computer that could talk and match wits with humans never really died. A few years ago a new plan was hatched, sparked by an unlikely event…IBM Documentary
Recently (Q4 2014) IBM launched a freemium cloud based analytics engine that can crunch millions of rows of numbers from your tablet or laptop. I had the opportunity to fool around with the interface this week. Awesome.
We must remember how IBM set this up. The strategy for the past couple of years was proving to the world that IBM Watson is indeed “smart artificial intelligence”. A machine that can learn from inputs. They have garnered that coveted spot with hard work and some engineering geniuses. Watch the 75 min video for a comprehensive look on how Watson was trained to win over the world Jeopardy champion.
Watch the Documentary on IBM Watson and how it was created:
This was not the first time IBM was proving their AI systems to the world. In 1996-1997, Deep Blue (the first iteration of the IBM smart machine platform) beat out the reigning world chess champion. More on that here.
After proving to the world that they have “the smartest machine on earth”, IBM is now delivering Watson brains to your laptop and tablet via a cloud based freemium service. The free beta version is nothing less than pure genius.
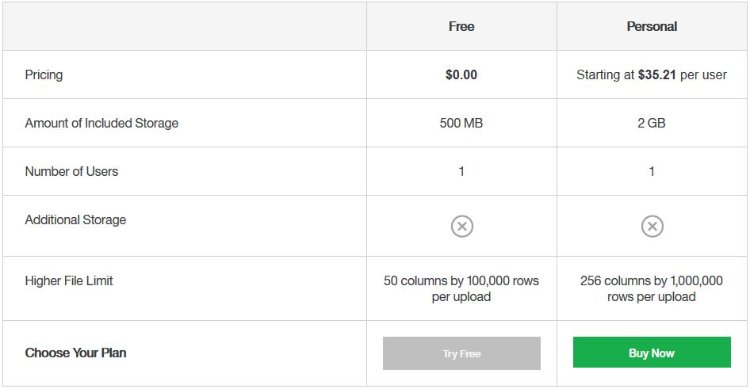
Out of the box pricing is free. It offers 500MB of data upload with a maximum of 50 columns and 100K rows. If you need a multi-user or enterprise platform the pricing of about $30 per user offers 2GB of storage (4x the free version) with capabilities of 256 columns and 1M rows of data.

The interface is great and easy to use if you have some basic knowledge about data interpretation. Here is what the opening interface page portal looks like:
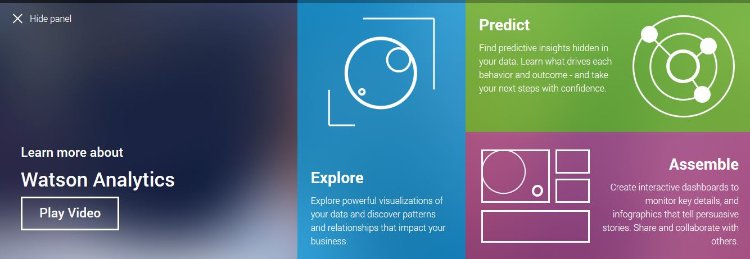

Once you’re in you can start uploading, exploring and predicting data. The data viewing interface allows you to create dashboard interfaces for reporting with infographics and slideshows too.
For the exploration and prediction of data models the interface is extremely user friendly and has all the geeky functions that data scientists drool over. You can create hierarchies, filter your RAW data tables right in the interface, rename columns, etc… All the fun stuff is included. Once your data is loaded it intuitively analyzes the quality of your data set. This thing is SMART!
The sweetest part is that the intuitive interface digs into the data sets to “suggest” data correlations that you might want to investigate in human language, and the suggested visualizations too. Once you load your data set you can ask a question about it just like you would Google something.
If you want to start using the free BETA version of IBM Watson Analytics follow the link:
Link to IBM Watson BETA Version – Sign up
If you want a great data set to start exploring and visualizing relationships I can suggest this link from the US Department of Transportation. You can download the RAW data on US Flight delays from all carriers for specific time periods.
US Department of Transportation – Flight Delays Data Sets
What it does not do?
As much as I enjoy the interface and the capabilities, I don’t want to over sell its capacity. There must be a fundamental understanding of what it does not do. It does not magically turn a data set into a pretty visualization that you can present to the board of directors. It does not correct for GIGO (garbage in = garbage out). It simplifies the process. Period.
It has some very interesting features under the hood, but you need to understand data and analytics first. Then you need to have logic and creativity embedded in your brain. Only then can you begin creating on this beautiful canvas they call IBM Watson Analytics. The Human Mind still trumps machine in my opinion.
Cheers. Comments, ideas, and opinions welcome.